Dev tools · alternatives · 2026

24 alternatives to CandyGraph, a flexible, fast-by-default WebGL plotting library
Fast by default, flexible 2D plotting library. Contribute to wwwtyro/candygraph development by creating an account on GitHub.
CandyGraph is a WebGL plotting library designed for fast, flexible data visualization. It enables developers to create interactive graphs and charts with high performance through GPU acceleration. The library… Below are 24 products that do a similar job, ranked by how close each is in meaning and then by launch-day votes. CandyGraph, a flexible, fast-by-default WebGL plotting library launched in 2021; newer entries below may have overtaken it.
- 1

Creator here. I built ChartGPU because I kept hitting the same wall: charting libraries that claim to be "fast" but choke past 100K data points. The core insight: Canvas2D is fundamentally CPU-bound. Even WebGL chart libraries still do most computation on the CPU. So I moved everything to the GPU via WebGPU: - LTTB downsampling runs as a compute shader - Hit-testing for tooltips/hover is GPU-accelerated - Rendering uses instanced draws (one draw call per series) The result: 1M points at 60fps with smooth zoom/pan. Live demo:…
Jan 2026 · github.com · its alternatives →
- 2

Ultra-fast and customizable Python charts. Contribute to reflex-dev/xy development by creating an account on GitHub.
Jul 2026 · github.com · its alternatives →
- 3

- 4

Create pro-level graphs that drive actions
2024 · graphy.app · its alternatives →
- 5IB
grafar is a JavaScript library for creating visualizations on the web, with 3D support via WebGL. Built for mathematical plotting, but also can also handle data visualization.
2021 · thoughtspile.github.io · its alternatives →
- 6

Many JS libraries exist to build graphs on the web (Vega, chartJS, Plotly...). They allow to make charts quickly. But you lose flexibility: you're limited by the options they offer. I just created a gallery with hundreds of graphs made with d3.js and React. - Examples are split by graph types - They all come with explanation and code sandboxes - Gradual complexity to ease the learning curve It took me ages to create this project! Feedback welcome!
2023 · react-graph-gallery.com · its alternatives →
- 7

- 8VO
vizzu - Library for animated data visualizations and data stories
2021 · lib.vizzuhq.com · its alternatives →
- 9
 Chart.js▲263
Simple, clean & engaging charts for designers and developers
2014 · chartjs.org · its alternatives →
- 10TJ
A JavaScript Library for creating SVG patterns
2015 · riccardoscalco.github.io · its alternatives →
- 11RT
2023 · antimatter15.com · its alternatives →
- 12
 Vizzu▲225
Open-source JS library to build animated charts with ease
2022 · vizzu.io · its alternatives →
- 13

Geometry library for C - Fast point-in-polygon. Contribute to tidwall/tg development by creating an account on GitHub.
2023 · github.com · its alternatives →
- 14

An interactive Ruby Object Graph Visualization. Contribute to mattbaker/ruby-heap-viz development by creating an account on GitHub.
2014 · github.com · its alternatives →
- 15

📈 A small, fast chart for time series, lines, areas, ohlc & bars - leeoniya/uPlot
2019 · github.com · its alternatives →
- 16

Here's a project I've been working on for a little while now. Ripl is a JS library that provides a unified API for rendering shapes on both canvas and SVG interchangeably. Over the years I've used D3 extensively to create data visualisations so I figured I'd have a go at making my own version with a slightly more modern API and stricter TypeScript support. I am aware there are already libraries that can draw to multiple contexts interchangeably, but I've added a few little niceties to Ripl that (as far as I know) some other libraries don't have such as CSS-like query selectors, DOM-like…
2024 · github.com · its alternatives →
- 17

Responsive HTML5 charts with 10x performance
2017 · canvasjs.com · its alternatives →
- 18

Hello, guys~ I recently developed a data exploration and visualization app which can be used as a different type of open-source alternative to Tableau. It is extremely easy to embed in your apps just as a react component. The original purpose is to develop a lite plugin that can be easily embedded in most cases, it doesn't have to be a large BI, but a lite graphic plugin. GitHub: Kanaries/graphic-walker, https://github.com/Kanaries/graphic-walker The main features implemented: * A user-friendly drag-and-drop-based interaction for exploratory data analysis with…
2023 · github.com · its alternatives →
- 19
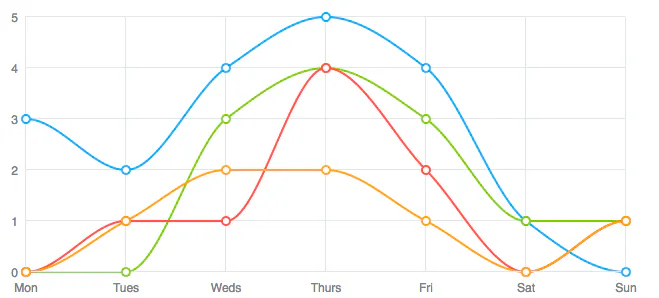 ZingChart▲92
JS Charting library that renders in HTML5, Canvas & Flash
2014 · zingchart.com · its alternatives →
- 20

A multi-threaded, GPU-powered, 2D vector graphics environment for Node.js - samizdatco/skia-canvas
2020 · github.com · its alternatives →
- 21

3d plotting for Python in the Jupyter notebook based on IPython widgets using WebGL - widgetti/ipyvolume
2017 · github.com · its alternatives →
- 22

Have you ever lost your mind at Desmos or Geogebra for occasionally being so god-damn slow and laggy? I have and, as a result, decided to make my own, GPU-accelerated (webgl2) graph plotter that renders equations, shaded plots, etc. with butter-smooth framerates. Equations we are used to think as unplottable (with usable real-time performance), like for example `e ^ (sin(x) * x ^ 2 * cos(y)) = cos(e ^ (x * y))`, will render just as smoothly [0] as something simple, like `y = x ^ 2`. Goals: * Rendering (almost) any equation without performance problems * Enabling acquiring new insights from…
2023 · kaapporaivio.fi · its alternatives →
- 23
 Plottable.js▲132
Flexible, interactive charts for the web.
2016 · plottablejs.org · its alternatives →
- 24GA
2016 · erkaman.github.io · its alternatives →
Also compare
- ChartGPU – WebGPU-powered charting library (1M points at 60fps) alternatives
- XY – A Fast, composable, GPU-accelerated interactive plotting library alternatives
- GraphFast alternatives
- Graphy for Data Storytelling alternatives
- I built Grafar, a visualization library alternatives
- A gallery of graphs built with React and D3.js alternatives
Ranked by how close each launch is in meaning, then by votes. Prices were read from each product’s own site when checked and can change. Refine with your own description →