Dev tools · alternatives · 2026

24 alternatives to Qt Visual Graph Editor
Software to visually create and manipulate graphs
Below are 24 products that do a similar job, ranked by how close each is in meaning and then by launch-day votes. Qt Visual Graph Editor launched in 2020; newer entries below may have overtaken it.
- 1
 Visual Editor▲504
Edit web apps visually in the Cursor Browser
Dec 2025 · cursor.com · its alternatives →
- 2
 GraphQL Editor▲156
Online GraphQL IDE, visualize your GraphQL Schema
2019 · graphqleditor.com · its alternatives →
- 3

Hi all! TikZ is a widely-used LaTeX package for drawing figures in papers. It uses commands like \draw[->] (0,0) -- (1,2); to draw lines, shapes, text, etc. Academics usually code up their figures by hand, so there is lots of twiddling around with the coordinates and recompiling until things look nice. I guess it’s a bit like SVG, but it’s more code than markup, for example it has loops with \foreach. I built an open-source WYSIWYG TikZ editor (available for web and desktop) that allows you to edit your TikZ source code visually by dragging and resizing elements. It simultaneously shows the…
Jun 2026 · tikz.dev · its alternatives →
- 4

📺 Visual Editor & GraphQL IDE. . Contribute to graphql-editor/graphql-editor development by creating an account on GitHub.
2019 · github.com · its alternatives →
- 5

📺 Visual Editor & GraphQL IDE. . Contribute to graphql-editor/graphql-editor development by creating an account on GitHub.
2021 · github.com · its alternatives →
- 6

- 7VG
2020 · treksit.netlify.app · its alternatives →
- 8
 Graphy Lite▲671
The best way to create & share charts on the internet
2023 · visualize.graphy.app · its alternatives →
- 9

A tool to create animated graph visualizations, based on graphviz. - GitHub - mapio/GraphvizAnim: A tool to create animated graph visualizations, based on graphviz.
2016 · github.com · its alternatives →
- 10DT
2019 · dot-to-ascii.ggerganov.com · its alternatives →
- 11
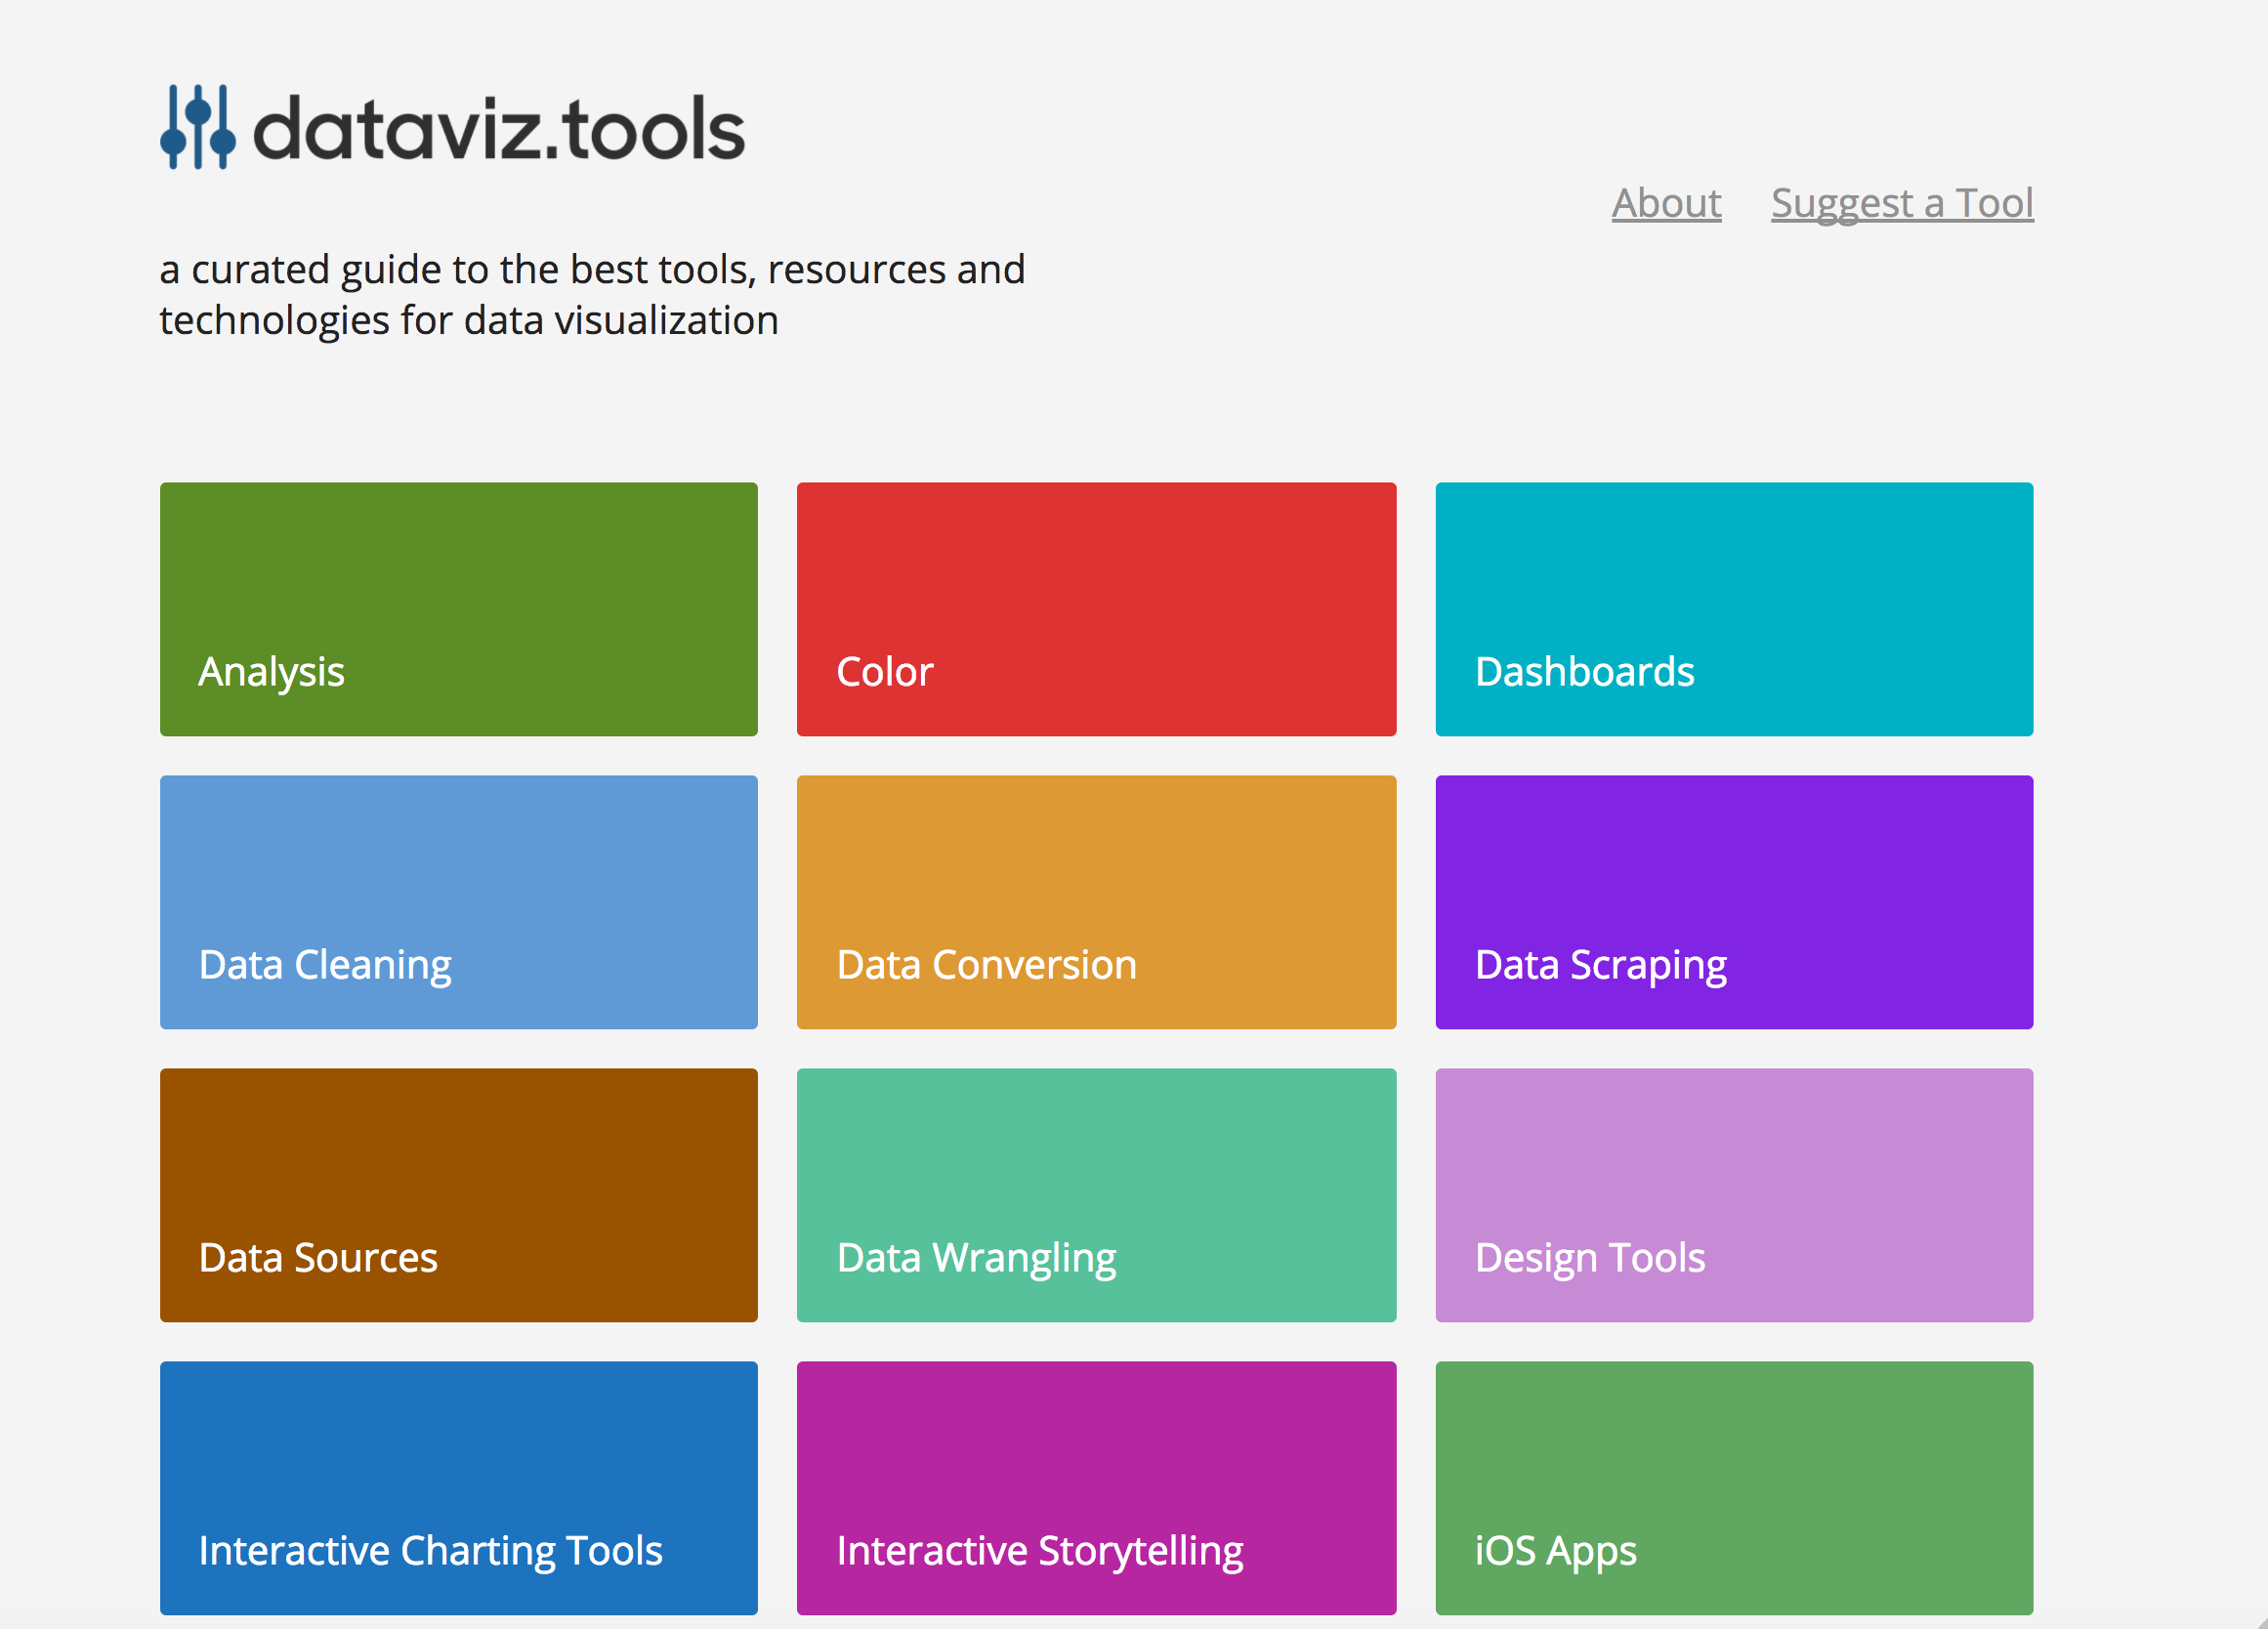 dataviz.tools▲409
Curated collection of the 400 best data visualization tools
2017 · dataviz.tools · its alternatives →
- 12

Building a GraphQL API just got a lot easier
2021 · graphqleditor.com · its alternatives →
- 13

Online WYSIWYG Mathematics Editor (Equation Editor), fast and powerful Editing features, inputting Normal text, Math symbols, and drawing Graph/Diagram in one single editor, help writing Math Document much easier. Export to Latex, Tikz, SVG, or Image (PNG).
2017 · mathcha.io · its alternatives →
- 14

This unofficial extension integrates Draw.io (also known as diagrams.net) into VS Code. - vscode-drawio/README.md at 14209ad462028cbf7013bc8e094bf0fc6e811d30 · hediet/vscode-drawio
2020 · github.com · its alternatives →
- 15
 CSS.GUI▲201
Open source visual editors for everything in the CSS spec
2022 · components.ai · its alternatives →
- 16
 VPaint▲145
The next Adobe Illustrator and After Effects, open-source
2021 · vpaint.org · its alternatives →
- 17

Blender-style 3D editing in your browser
May 2026 · 3d-editor.com · its alternatives →
- 18

2017 · zwischenzugs.com · its alternatives →
- 19

Creating high-quality scientific figures can be time-consuming and challenging, even though sketching ideas on paper is relatively easy. Furthermore, recreating existing figures that are not stored in formats preserving semantic information is equally complex. To tackle this problem, we introduce DeTikZify, a novel multimodal language model that automatically synthesizes scientific figures as semantics-preserving TikZ graphics programs based on sketches and existing figures. We also introduce a Monte Carlo Tree Search-based inference algorithm that enables DeTikZify to iteratively refine its…
2024 · github.com · its alternatives →
- 20IG
Data automation and visualization platform for spreadsheet users.
2024 · columns.ai · its alternatives →
- 21

Layout is a rust library and a tool that renders Graphviz dot files. - nadavrot/layout
2022 · github.com · its alternatives →
- 22

grapher - SVG-based interactive graph dataset editor with live real-time collaboration. Powers Foresight Institute's civilizational tech trees: https://foresight.org/tech-tree/
2022 · codeberg.org · its alternatives →
- 23AD
2018 · blog.jupyter.org · its alternatives →
- 24

Visualize boring data into beautiful charts & graphs.
2017 · visme.co · its alternatives →
Also compare
Ranked by how close each launch is in meaning, then by votes. Prices were read from each product’s own site when checked and can change. Refine with your own description →