Dev tools · alternatives · 2026
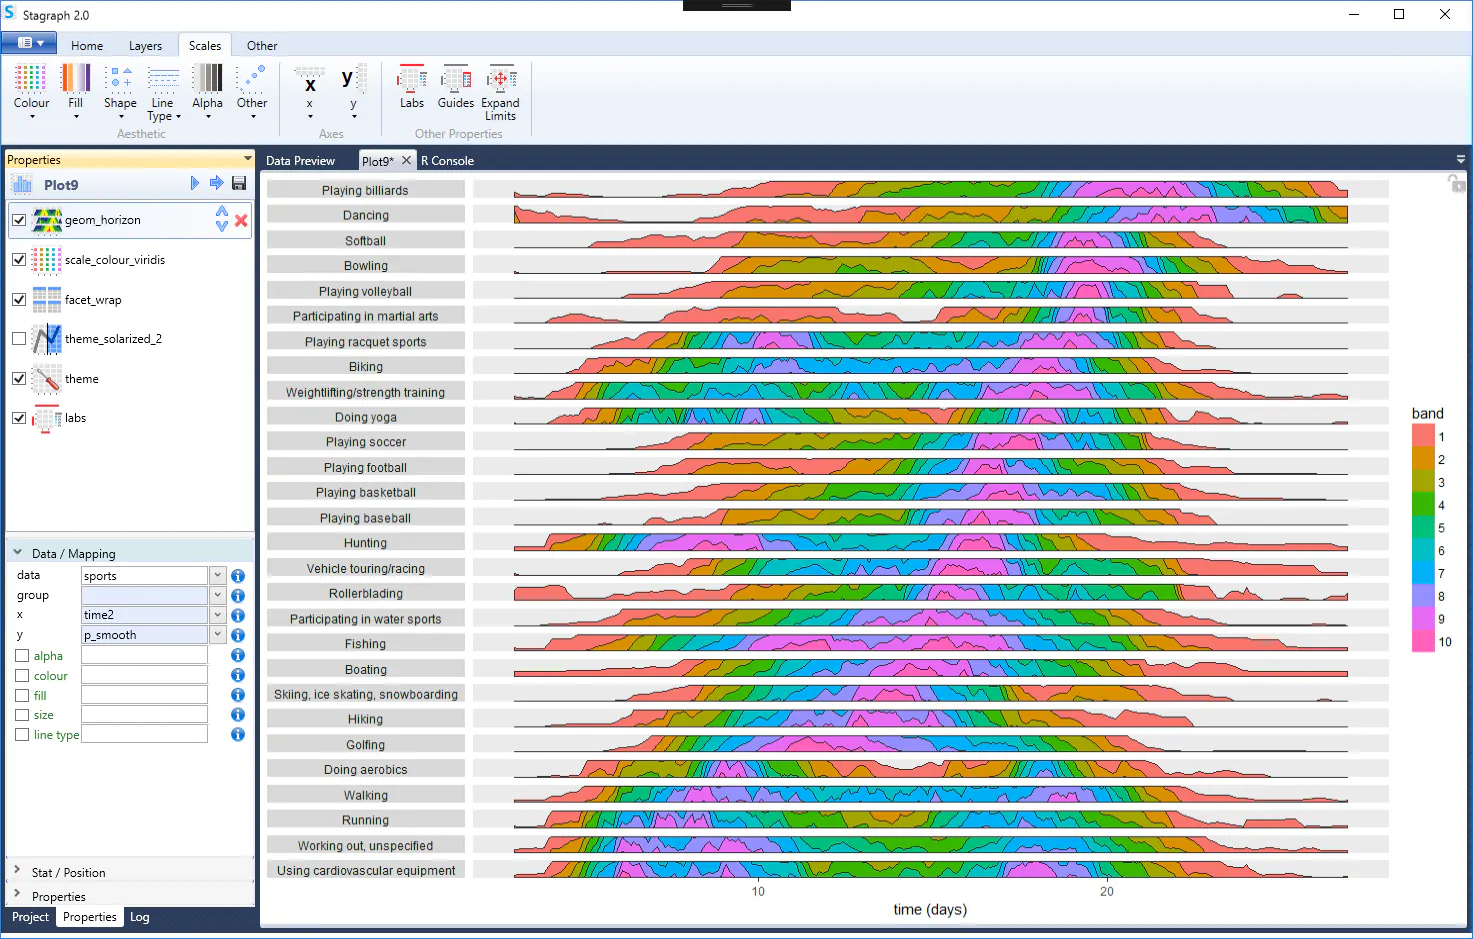
24 alternatives to Stagraph 2.0
Connect » Clean » Wrangle » Combine » Explore » Publish
Below are 24 products that do a similar job, ranked by how close each is in meaning and then by launch-day votes. Stagraph 2.0 launched in 2016; newer entries below may have overtaken it.
- 1CT
2018 · stagraph.com · its alternatives →
- 2

- 3
 Whatagraph▲221
Marketing performance reports for marketing people 📊
2016 · whatagraph.com · its alternatives →
- 4

Create pro-level graphs that drive actions
2024 · graphy.app · its alternatives →
- 5
 Charts▲348
The most comprehensive collection of charts for Sketch
2019 · charts.graphics · its alternatives →
- 6SS
2014 · seenaburns.github.io · its alternatives →
- 7
 Chart.js 2.0▲440
Simple, clean & engaging charts for designers & developers.
2016 · chartjs.org · its alternatives →
- 8

- 9

- 10

Photo Animation Software that creates a new way of displayin
2016 · plotagraphpro.com · its alternatives →
- 11

- 12VO
vizzu - Library for animated data visualizations and data stories
2021 · lib.vizzuhq.com · its alternatives →
- 13

- 14
- 15

- 16

Simple, elegant and informative website statistic reports
2015 · whatagraph.com · its alternatives →
- 17

Creating high-quality scientific figures can be time-consuming and challenging, even though sketching ideas on paper is relatively easy. Furthermore, recreating existing figures that are not stored in formats preserving semantic information is equally complex. To tackle this problem, we introduce DeTikZify, a novel multimodal language model that automatically synthesizes scientific figures as semantics-preserving TikZ graphics programs based on sketches and existing figures. We also introduce a Monte Carlo Tree Search-based inference algorithm that enables DeTikZify to iteratively refine its…
2024 · github.com · its alternatives →
- 18

EASILY ANIMATE YOUR IMAGES AND STAND OUT OF THE CROWD
2016 · plotagraphpro.com · its alternatives →
- 19DE
2012 · datafart.com · its alternatives →
- 20

- 21
- 22

The Graph that Generates Stories. Contribute to incrediblesound/story-graph development by creating an account on GitHub.
2015 · github.com · its alternatives →
- 23

Hi HN, We're a small team working on a new dataviz engine and its applications. We built our charting engine in C++ and run it on WebAssembly. Two years ago, we launched Vizzu as an open-source animated data visualization library aimed at JS developers, allowing users to create dynamic charts. We also released a Python wrapper under the name ipyvizzu for data scientists. Since then, we've been working hard to make this technology accessible to everyone, regardless of their coding skills. Today, we're proud to introduce our no-code storytelling tool. With this tool, anyone can turn their…
2024 · vizzu.io · its alternatives →
- 24

We are excited to announce the launch of our new visual Aha! charting tool which allows you to create visual reports on all of your product roadmap data.
2016 · blog.aha.io · its alternatives →
Also compare
Ranked by how close each launch is in meaning, then by votes. Prices were read from each product’s own site when checked and can change. Refine with your own description →