Dev tools · alternatives · 2026

24 alternatives to streamgraph.js, now on github
Streamgraphs are cool. They're great at displaying trends in data over time, similar to a stacked graph, but much prettier. The first one I saw was Lee Byron's Last.fm listening history graphic, a...
Below are 24 products that do a similar job, ranked by how close each is in meaning and then by launch-day votes. streamgraph.js, now on github launched in 2010; newer entries below may have overtaken it.
- 1

Many JS libraries exist to build graphs on the web (Vega, chartJS, Plotly...). They allow to make charts quickly. But you lose flexibility: you're limited by the options they offer. I just created a gallery with hundreds of graphs made with d3.js and React. - Examples are split by graph types - They all come with explanation and code sandboxes - Gradual complexity to ease the learning curve It took me ages to create this project! Feedback welcome!
2023 · react-graph-gallery.com · its alternatives →
- 2
 Vizzu▲225
Open-source JS library to build animated charts with ease
2022 · vizzu.io · its alternatives →
- 3
 Chart.js 2.0▲440
Simple, clean & engaging charts for designers & developers.
2016 · chartjs.org · its alternatives →
- 4
 Chart.js 4.0▲111
Open source JavaScript charting library for the modern web
2022 · github.com · its alternatives →
- 5UF
2021 · trungdq88.github.io · its alternatives →
- 6

- 7
 Charts▲348
The most comprehensive collection of charts for Sketch
2019 · charts.graphics · its alternatives →
- 8
 Chart.js▲263
Simple, clean & engaging charts for designers and developers
2014 · chartjs.org · its alternatives →
- 9

📈 A small, fast chart for time series, lines, areas, ohlc & bars - leeoniya/uPlot
2019 · github.com · its alternatives →
- 10

- 11
- 12TL
2018 · charts.com · its alternatives →
- 13

- 14
 BStreams▲62
Interactive, easy, responsive data visualization & analysis
2021 · bstreams.io · its alternatives →
- 15VO
vizzu - Library for animated data visualizations and data stories
2021 · lib.vizzuhq.com · its alternatives →
- 16

Responsive HTML5 charts with 10x performance
2017 · canvasjs.com · its alternatives →
- 17
 Plottable.js▲132
Flexible, interactive charts for the web.
2016 · plottablejs.org · its alternatives →
- 18TS
In this blog post, I will cover how to make a sparkline using d3.js . Our final product will look like this: For those who are unfamili...
2016 · dataviztalk.blogspot.com · its alternatives →
- 19GA
Hi everyone! Graphs is the intersection of data visualization and the daily web puzzle genre (Wordle, NYT Mini Crossword, Connections, etc.). Every day, you are given a nameless graph and 5 options to select the right dataset it is representing. Upon winning, you can access the underlying dataset and other info + maintain a streak and stats. It's super simple - check out today's chart and you should be able to get the gist quickly. My email + twitter account (@graphsgame) is on the page, would love a feedback or a follow. Don't hesitate to reach out!
2024 · graphs.world · its alternatives →
- 20

- 21
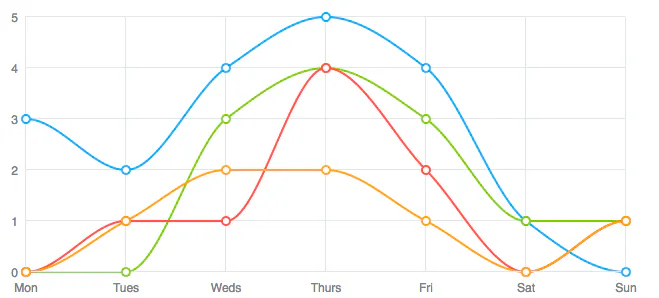 ZingChart▲92
JS Charting library that renders in HTML5, Canvas & Flash
2014 · zingchart.com · its alternatives →
- 22
 TimelineJS▲87
Beautifully crafted timelines that are easy to use.
2014 · timeline.knightlab.com · its alternatives →
- 23

Rerun 0.21 comes with a new graph viewer that's written in Rust and runs in the browser via wasm. It's powered by a new force based layout engine that is a port of much of d3-force to Rust. (The release also contains some other cool stuff like undo/redo implemented on top of a timeseries DB.) We built this with applications in robotics and spatial computing in mind but would love to hear feedback from folks that would see this as useful in other domains as well.
2024 · rerun.io · its alternatives →
- 24

Also compare
Ranked by how close each launch is in meaning, then by votes. Prices were read from each product’s own site when checked and can change. Refine with your own description →