Alternatives
Products that do what StreetIntel does
Find out who you are as an NYC driver
- 1IN
Hey HN! I wanted to share something I built over the last few weeks: isometric.nyc is a massive isometric pixel art map of NYC, built with nano banana and coding agents. I didn't write a single line of code. Of course no-code doesn't mean no-engineering. This project took a lot more manual labor than I'd hoped! I wrote a deep dive on the workflow and some thoughts about the future of AI coding and creativity: http://cannoneyed.com/projects/isometric-nyc
Jan 2026 · cannoneyed.com
- 2RI
New York City has this cool program that lets anyone report idling commercial vehicles and get a large cut of the fines [1]. It's been in the news recently [2]. I've filed a few reports, and I found the process frustrating and error-prone. The forms are fiddly, there's way too much information that needs to be copied down from the video by hand, you have to use a third-party app to take a timestamped video and a different app to compress it before uploading, and approximately none of it can be done on your phone — the device you probably used to record your video in the first place. I built…
2025 · apps.apple.com
- 3AW
For the past few months, I've been working on a website that answers two different questions: - Where in my city have the best travel times to all the things and people I care about? - Given a listing, how far is it from all the things and people I care about? Personally this was fueled by my own frustrations when I was apartment hunting in NYC. I was frustrating to have to juggle so many Google Maps tabs when I was evaluating a listing, and it was also annoying to not have full confidence that I was even searching in the right places. I wanted to be close to work, a Trader Joe's, and a…
2025 · theretowhere.com
- 4AL
Built this over the last few days, based on a Rust codebase that parses the latest ALPR reports from OpenStreetMaps, calculates navigation statistics from every tagged residential building to nearby amenities, and tests each route for intersection with those ALPR cameras (Flock being the most widespread). These have gotten more controversial in recent months, due to their indiscriminate large scale data collection, with 404 Media publishing many original pieces (https://www.404media.co/tag/flock/) about their adoption and (ab)use across the country. I wanted to use…
Dec 2025 · alpranalysis.com
- 5

- 6NS
Hello HN! As a long term NYC resident, I have read countless articles on ideas tweaking subway services, but always found them hard to follow without visual aid. So over the long weekend I decided to build one. It has all the basic features: trains would spawn at their origin, stop at stations, and slow down if it gets too close to another. You can also design custom routes by piecing tracks together. Have fun, and let me know what you think!
2025 · buildmytransit.nyc
- 7
- 8

- 9
- 10RL
Hey, just a work related project I made, which could be open sourced :D If you're looking for an example on how to use/fine-tune yolov8, I feel like taking a look at this repo and reading the README could help you get up to speed (also linked some nice refs)! This is actually a full rewrite of a proprietary project I made (and documented on my site) like a year ago, will do some finishing touches (write blog post about it, mark the old version deprecated, record a tutorial on how to set it up on an Ubuntu server, etc, etc) in the following month, but felt like sharing it now, cuz I…
2023 · github.com
- 11

- 12

- 13

- 14

- 15

- 16

- 17IV
Each moving arrow represents one real bike ride out of 291 million, and if you've ever taken a Citi Bike before, you are included in this massive visualization! You can search for your ride using Cmd + K and your Citi Bike receipt, which should give you the time of your ride and start/end station. Everything is open source: https://github.com/freemanjiang/bikemap Some technical details: - No backend! Processed data is stored in parquet files on a Cloudflare CDN, and queried directly by DuckDB WASM - deck.gl w/ Mapbox for GPU-accelerated rendering of thousands of…
Jan 2026 · bikemap.nyc
- 18WW
I was walking around New York last month during some light rain and noticed about half the people had umbrellas open. When the rain picked up a few minutes later, that number jumped closer to 80%. It got me thinking it'd be cool to track this somehow, so I built a website! I am taking a sidewalk livestream, feeding it into a YOLO model for people tracking, then sending a frame of each detected person to Gemini 2.0 Flash, which returns structured JSON about each person's clothing and if they're holding an umbrella. I also had fun making the site look like a TV weather channel. I showed some…
2025 · walzr.com
- 19MR
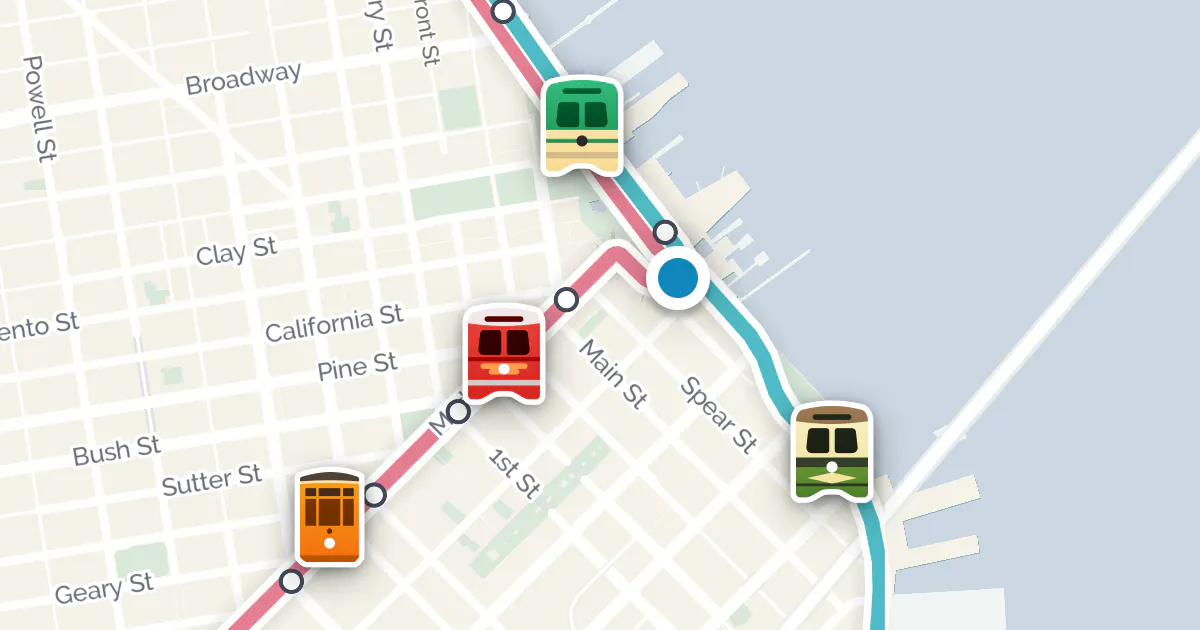
During a recent subway outage in San Francisco I decided to build a webapp in the spirit of "Do I Need an Umbrella," basically to answer the question "Should I take the subway or a bus?" In the interest of learning new tools I decided to vibe code it as much as possible. First, I had Claude Code write a background script to download images of the real-time circuit diagram of the subway, which are publicly available here: http://sfmunicentral.com/ Next I had it build an image labeler tool in tkinter, which turned out to need a lot of manual tweaking before I could even get to…
Jan 2026 · munimet.ro
- 20CF
This started as a project to scratch my own itch and has grown from there. Initially I wanted a way to easily see if potential funny license plates were available in a given state, but I've also started using it at car shows when I'm curious which engine or transmission is in a car. It most cases the plate can be matched to a VIN using DMV data, and then some information about the vehicle can be decoded into basic car specs You can also purchase a full vehicle history report which uses data from the NMVTIS and other services to show accident history, previous titles, and salvage issues. The…
2023 · checkanyvin.com
- 21SV
2020 · callumprentice.github.io
- 22

- 23

- 24RIRyd.io▲9
Ryd.io As a capstone project for Galvanize's data science immersive I took another look at the NYC Taxi data set. A ton of analysis has been done on individual rides/cars and I was curious about what story would be told by looking at this data through the aggregate. Through the clustered map you can identify different 'personalities' of the city with a birds eye view. Check it out here http://ryd.io/cluster_map I've just spent past couple weeks working hard on this project and would love to talk to anyone about it if they are interested. After the conclusion of the…
2015
Ranked by how close each launch is in meaning, then by votes. Refine with a description →