Life & fun · alternatives · 2026
24 alternatives to Tableau-like Data Visualization library (free), powered by WebAssembly
Muze is a free data visualization library built with WebAssembly that enables interactive charting and analysis similar to Tableau. Launched in 2020, it allows developers to create dynamic dashboards and visual… Below are 24 products that do a similar job, ranked by how close each is in meaning and then by launch-day votes. Tableau-like Data Visualization library (free), powered by WebAssembly launched in 2020; newer entries below may have overtaken it.
- 1

Tableau-like visualizations in JavaScript (Open Source)
2018 · its alternatives →
- 2TL
2018 · charts.com · its alternatives →
- 3

- 4
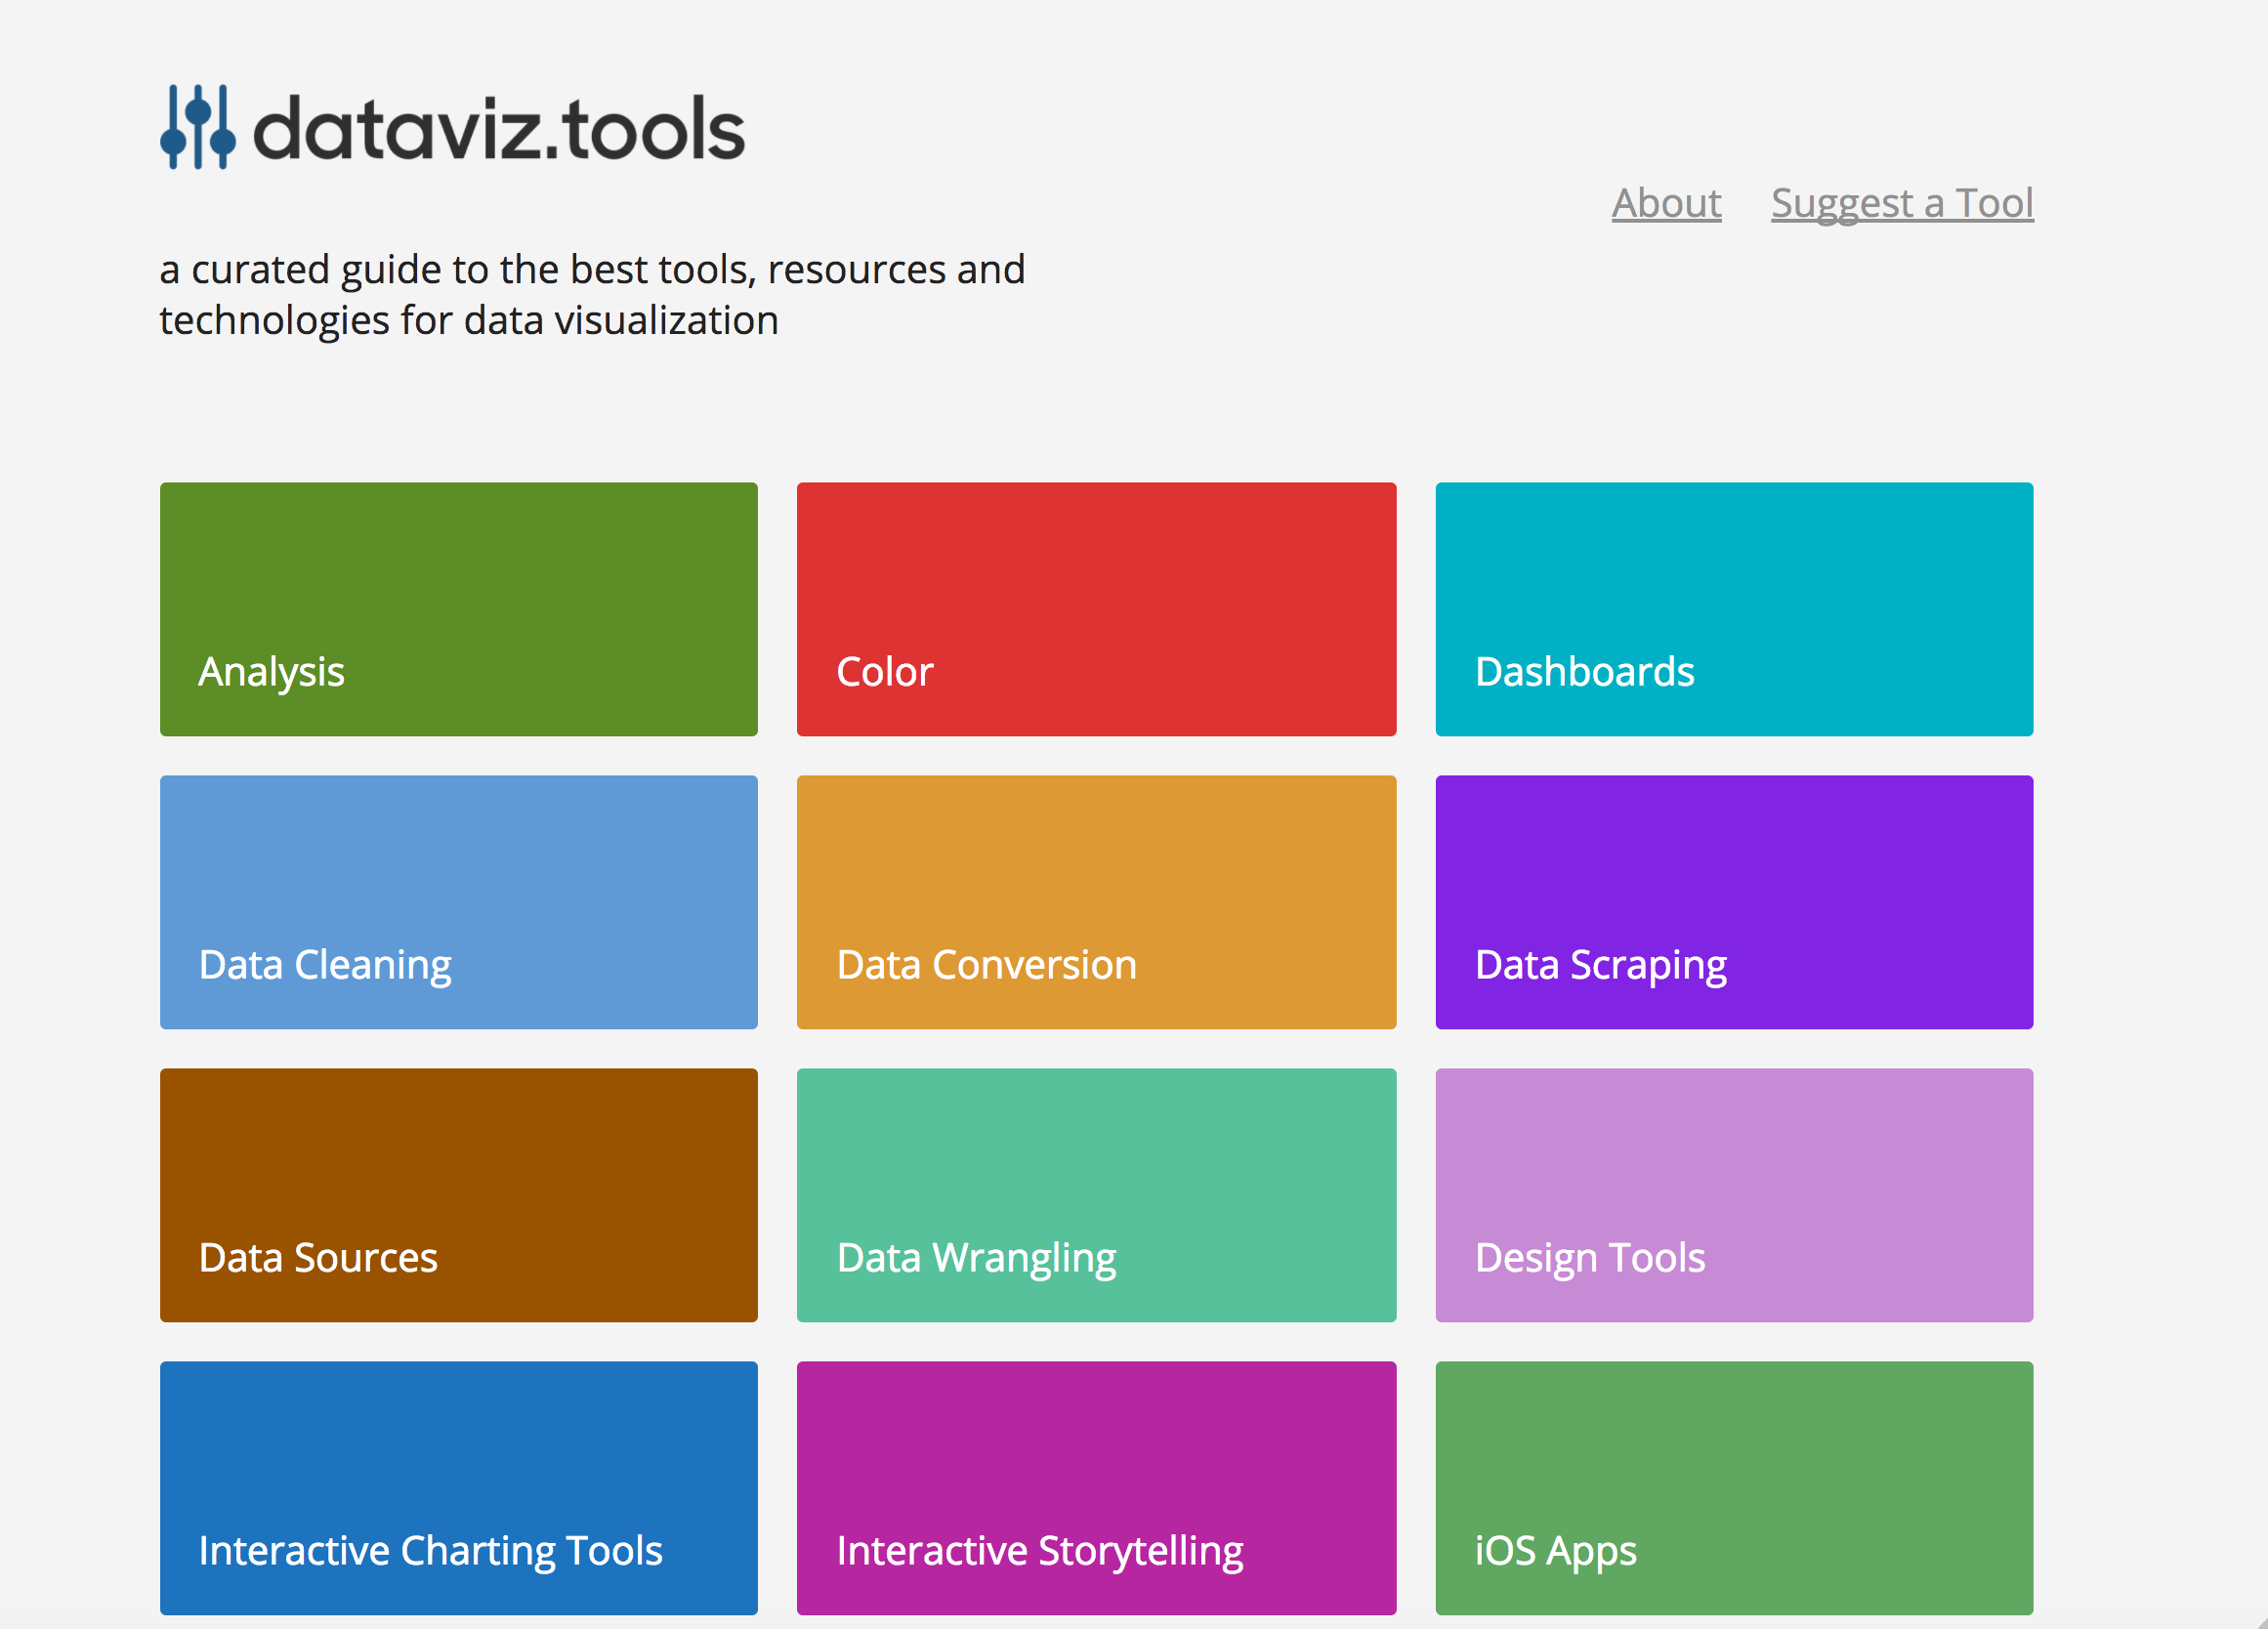 dataviz.tools▲409
Curated collection of the 400 best data visualization tools
2017 · dataviz.tools · its alternatives →
- 5
 Sheetbase▲450
Free, fast and fun way to build modern websites and apps 🛠️
2018 · sheetbase.net · its alternatives →
- 6

Hello, guys~ I recently developed a data exploration and visualization app which can be used as a different type of open-source alternative to Tableau. It is extremely easy to embed in your apps just as a react component. The original purpose is to develop a lite plugin that can be easily embedded in most cases, it doesn't have to be a large BI, but a lite graphic plugin. GitHub: Kanaries/graphic-walker, https://github.com/Kanaries/graphic-walker The main features implemented: * A user-friendly drag-and-drop-based interaction for exploratory data analysis with…
2023 · github.com · its alternatives →
- 7
 ADS-B visualizer▲339
I've created a web app for querying and visualization of ADS-B datasets: https://adsb.exposed/ Source code: https://github.com/ClickHouse/adsb.exposed/ The results significantly exceeded my expectations because the pictures are insanely beautiful, and the data is a treasure trove. It proves many statements that were not certain: - it is feasible to generate tiles by aggregation on a pixel level (instead of hexagons or rectangular grid); - it does not require JPG/PNG tiles - we can transfer raw bitmap data with zstd compression; - it is possible to…
2024 · adsb.exposed · its alternatives →
- 8

- 9
 Embedding Atlas▲150
Hey HN, we're happy to release Mycelium, a JavaScript library for creating graph visualizations of machine learning models or any other directed acyclic graphs. Mycelium powers the graph viewer of the Talaria [0] a research model visualization and optimization system, which was used to optimize the efficiency of Apple Foundation Models [1]. Everything works entirely on the client-side in the browser — we provide a rudimentary ONNX loader out of the box, which you can try by dragging model files into our website. It is also simple to define loaders for your own model formats. The library was…
2025 · apple.github.io · its alternatives →
- 10VO
vizzu - Library for animated data visualizations and data stories
2021 · lib.vizzuhq.com · its alternatives →
- 11

Create interactive data tables in seconds with Tabulator. A free, open source, fully featured JavaScript table / data grid generation library.
2018 · tabulator.info · its alternatives →
- 12

- 13

Hey all! I released drawDB about a month ago and now it's open source. I hope you find it useful. If you want to check out the app you can go to https://drawdb.vercel.app/ . Thank you:)
2024 · github.com · its alternatives →
- 14
 WebCurate▲323
1700+ Highly useful tools you might not have known before
2024 · webcurate.co · its alternatives →
- 15

- 16

- 17MO
2018 · anvaka.github.io · its alternatives →
- 18

Free JavaScript library for data visualization & analysis
2019 · webdatarocks.com · its alternatives →
- 19

- 20

Fast by default, flexible 2D plotting library. Contribute to wwwtyro/candygraph development by creating an account on GitHub.
2021 · github.com · its alternatives →
- 21

Hi HN, We're a small team working on a new dataviz engine and its applications. We built our charting engine in C++ and run it on WebAssembly. Two years ago, we launched Vizzu as an open-source animated data visualization library aimed at JS developers, allowing users to create dynamic charts. We also released a Python wrapper under the name ipyvizzu for data scientists. Since then, we've been working hard to make this technology accessible to everyone, regardless of their coding skills. Today, we're proud to introduce our no-code storytelling tool. With this tool, anyone can turn their…
2024 · vizzu.io · its alternatives →
- 22CA
2020 · cubeweaver.com · its alternatives →
- 23

Statechart library and editor. Contribute to jonasblixt/ufsm development by creating an account on GitHub.
2018 · github.com · its alternatives →
- 24

Also compare
Ranked by how close each launch is in meaning, then by votes. Prices were read from each product’s own site when checked and can change. Refine with your own description →