Life & fun · alternatives · 2026
24 alternatives to Visualizations of inequalities around the world
Below are 24 products that do a similar job, ranked by how close each is in meaning and then by launch-day votes. Visualizations of inequalities around the world launched in 2017; newer entries below may have overtaken it.
- 1

- 2
The bible for people interested in presenting information
2015 · amazon.com · its alternatives →
- 3
 tota11y▲102
An accessibility visualization toolkit from Khan Academy
2015 · khan.github.io · its alternatives →
- 4
A beginners visual approach to Bayesian data analysis
2017 · amazon.com · its alternatives →
- 5
 Globestudio▲84
Open-source dotted maps and 3D globes for designers
25d ago · globestudio.app · its alternatives →
- 6

API for beautiful interactive graphics from time-series data
2014 · metricsgraphicsjs.org · its alternatives →
- 7

2019 · income-inequality.info · its alternatives →
- 8
A visual introduction to probability and statistics 📊
2017 · students.brown.edu · its alternatives →
- 9

Visualization engine for international trade data.
2017 · media.mit.edu · its alternatives →
- 10VS
2011 · statseer.com · its alternatives →
- 11AT
2019 · anvaka.github.io · its alternatives →
- 12NG
2015 · rocurley.github.io · its alternatives →
- 13ND
2014 · blog.spritesapp.com · its alternatives →
- 14AV
2021 · humanrandomness.com · its alternatives →
- 15

The essential collection of visualisation resources
2017 · visualisingdata.com · its alternatives →
- 16

2014 · comparea.org · its alternatives →
- 17TS
- 18
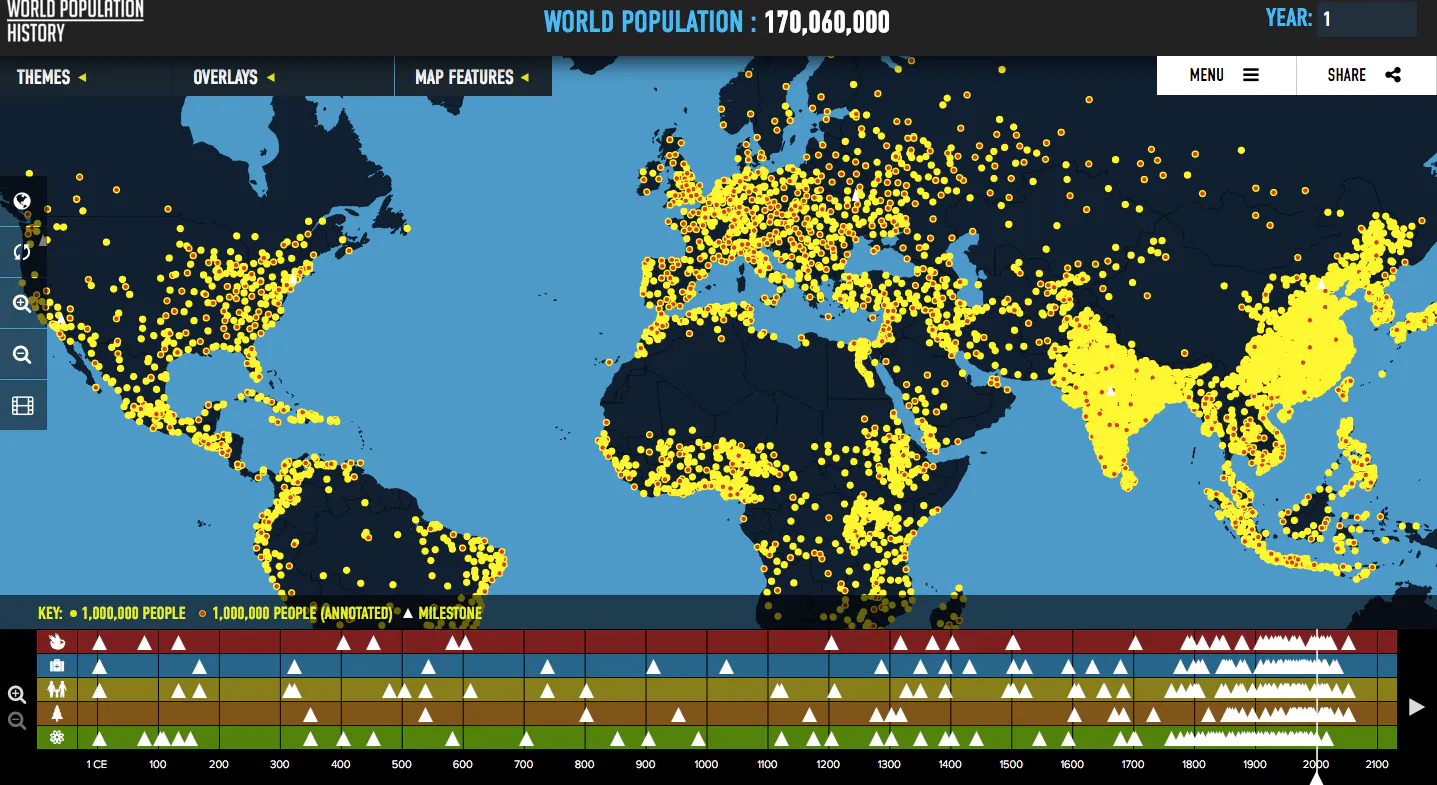
Visualizes global population trends over the last two thousa
2016 · worldpopulationhistory.org · its alternatives →
- 19AI
2019 · tempusfugit.ch · its alternatives →
- 20GS
2014 · gridvisual.com · its alternatives →
- 21BV
Beautiful Data Science
2020 · shahinrostami.com · its alternatives →
- 22VB
2021 · observablehq.com · its alternatives →
- 23
 Flourish▲7
Next-generation platform for data visualisation.
2017 · flourish.studio · its alternatives →
- 24M3
2015 · gmarland.github.io · its alternatives →
Also compare
Ranked by how close each launch is in meaning, then by votes. Prices were read from each product’s own site when checked and can change. Refine with your own description →