Life & fun · alternatives · 2026

24 alternatives to Income-inequality.info – visualize world income inequality
Income-inequality.info is a visualization tool that displays global income inequality data. Launched in 2019, it presents complex economic information through interactive graphics and charts. The platform is designed… Below are 24 products that do a similar job, ranked by how close each is in meaning and then by launch-day votes. Income-inequality.info – visualize world income inequality launched in 2019; newer entries below may have overtaken it.
- 1
 dataviz.tools▲409
Curated collection of the 400 best data visualization tools
2017 · dataviz.tools · its alternatives →
- 2

- 3VO
2017 · equality.website · its alternatives →
- 4

Calculate your SaaS income and compare payment processors
2017 · csabakissi.com · its alternatives →
- 5IT
2015 · incometaxcalculator.net.in · its alternatives →
- 6

- 7
 Chart.js 2.0▲440
Simple, clean & engaging charts for designers & developers.
2016 · chartjs.org · its alternatives →
- 8

- 9

Charts and infographics constructor in Figma
2021 · store.123d.one · its alternatives →
- 10

Visualize your pay growth and compare offers 📊
2020 · levels.fyi · its alternatives →
- 11DV
2017 · dvblogger.com · its alternatives →
- 12

Catalog of all chart types and tools to build them
2017 · visualizationuniverse.com · its alternatives →
- 13

- 14

- 15

Reference tool for data visualisation
2016 · datavizcatalogue.com · its alternatives →
- 16

Explore dados socioeconômicos do Brasil com o DataViva. Diagnósticos regionais, gráficos interativos, rankings e laboratórios de pesquisa sobre emprego, comércio internacional e desenvolvimento regional.
2015 · dataviva.info · its alternatives →
- 17WP
2014 · roadtolarissa.com · its alternatives →
- 18

A framework for 3D geospatial visualization in the browser - UDST/vizicities
2016 · github.com · its alternatives →
- 19

Data analysis that works for engineers. World-leading time series data analysis platform for engineering teams.
2020 · getmarple.io · its alternatives →
- 20
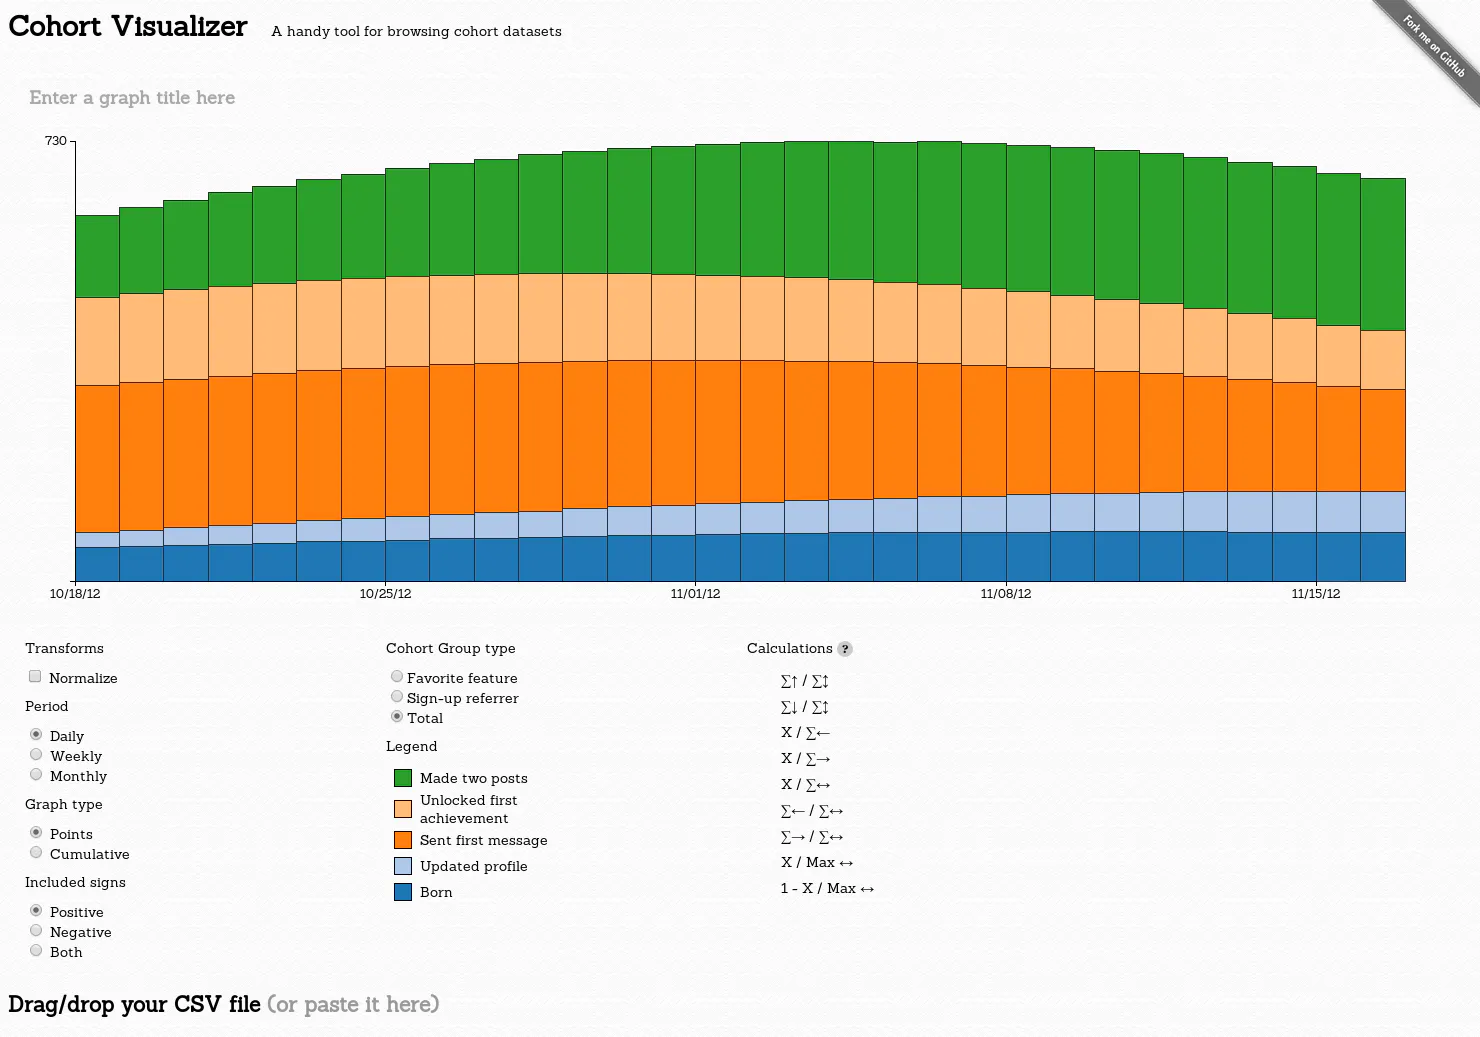
A handy tool for browsing cohort datasets
2014 · bslatkin.github.io · its alternatives →
- 21SC
2015 · statisticalatlas.com · its alternatives →
- 22

Embeddable salary data & visuals to promote transparency
2019 · levels.fyi · its alternatives →
- 23

Analyze remote work trends for U.S. cities with census data
2019 · pragli.com · its alternatives →
- 24

GitHub Gist: instantly share code, notes, and snippets.
2013 · bl.ocks.org · its alternatives →
Also compare
Ranked by how close each launch is in meaning, then by votes. Prices were read from each product’s own site when checked and can change. Refine with your own description →