Life & fun · alternatives · 2026

24 alternatives to Explore Brazil through 1 Billion+ visualizations
Explore dados socioeconômicos do Brasil com o DataViva. Diagnósticos regionais, gráficos interativos, rankings e laboratórios de pesquisa sobre emprego, comércio internacional e desenvolvimento regional.
DataViva is a data visualization platform for exploring Brazil's socioeconomic information. It provides regional diagnoses, interactive charts, and rankings covering employment, international trade, and regional… Below are 24 products that do a similar job, ranked by how close each is in meaning and then by launch-day votes. Prices are shown for the 1 we have checked on their own sites, 1 of them free or with a free tier. Explore Brazil through 1 Billion+ visualizations launched in 2015; newer entries below may have overtaken it.
- 1
 dataviz.tools▲409
Curated collection of the 400 best data visualization tools
2017 · dataviz.tools · its alternatives →
- 2

Social and marketing data visualization.
2018 · brandwatch.com · its alternatives →
- 3

- 4

- 5

Charts and infographics constructor in Figma
2021 · store.123d.one · its alternatives →
- 6

Creating data visualizations with AI nowadays often means chat, chat and more chats...and writing long prompts can be annoying while they are also not the most effective way to describe your visualization designs. Data Formulator blends UI interaction with natural language so that you can create visualizations with AI much more effectively! You can: * create rich visualizations beyond initial datasets, where AI helps transforming and visualizing data along the way * iterate your designs and dive deeper using data threads, a new way to manage your conversation with AI. Here is a demo video:…
2024 · github.com · its alternatives →
- 7

- 8VO
Hello HN. I've always found writing data visualisation scripts boring and repetitive in data science workflows earlier in my career, so I built this tool to automate it. The available methods are based on my experience in econometrics where histograms and scatterplots were the starting points to check data distributions. The link is to the documentation and the app is freely available at https://visprex.com, and if you're curious about the implementation it's open source at https://github.com/visprex/visprex. I'd appreciate any comments and feedback!
2024 · docs.visprex.com · its alternatives →
- 9
 ChartPixel▲80
Extract & visualize key insights from raw data in seconds!
2024 · chartpixel.com · its alternatives →
- 10
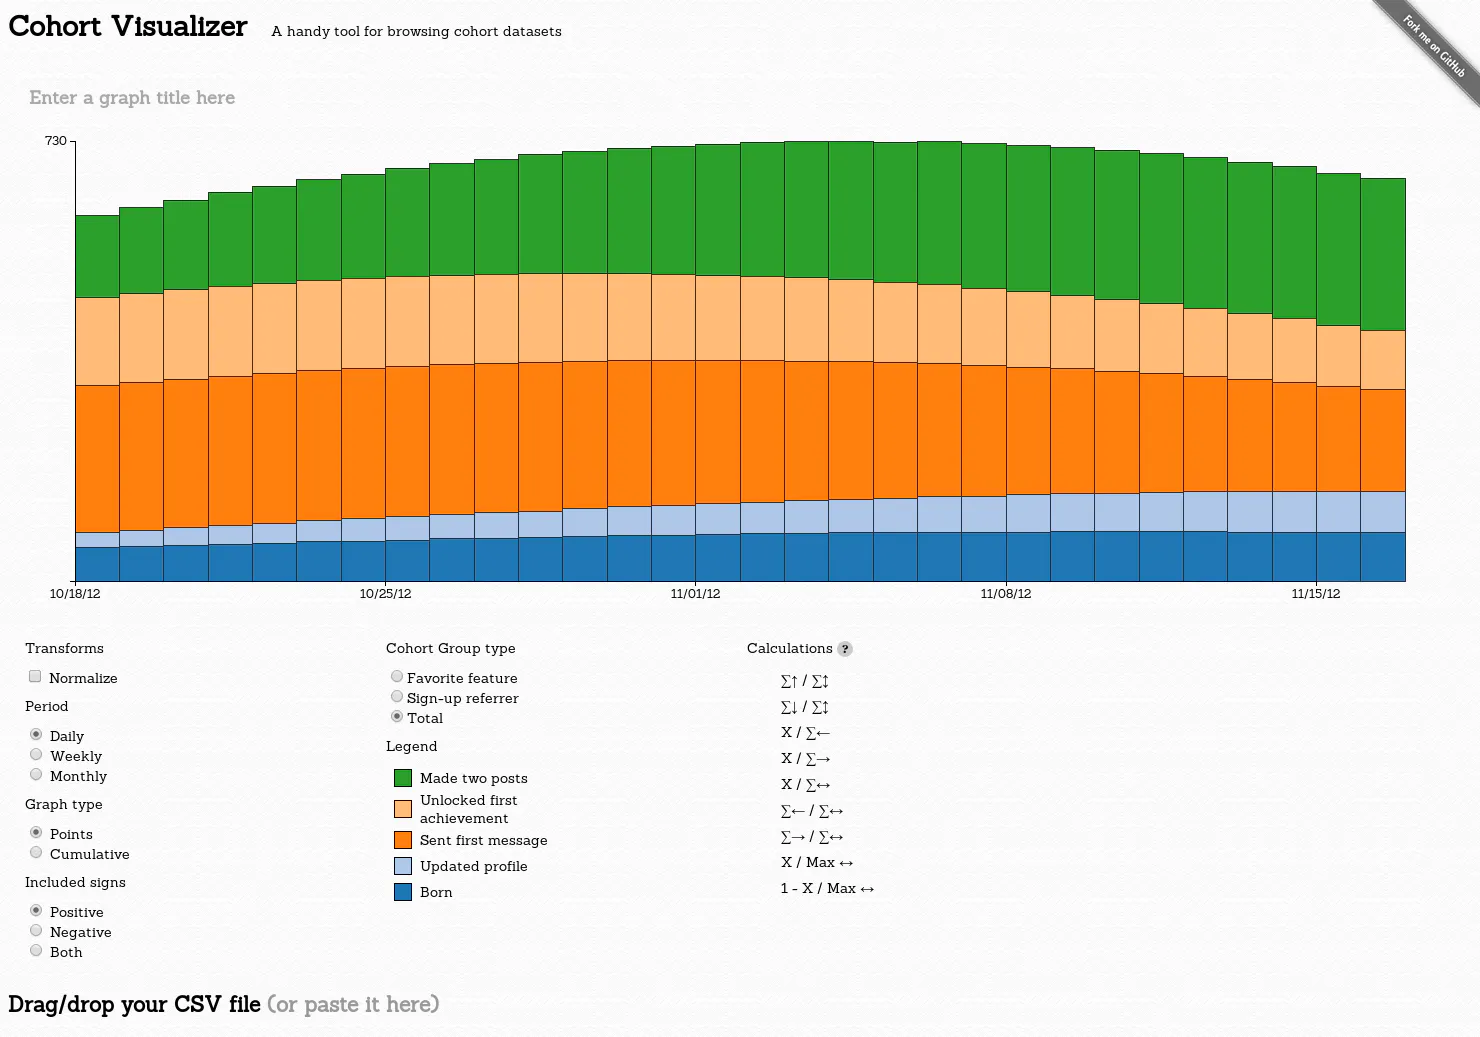
A handy tool for browsing cohort datasets
2014 · bslatkin.github.io · its alternatives →
- 11

- 12

Agentic data platform for robotics. Collect, triage and debug fleet data, search every run, and curate datasets to train your next model. Free to start.
2021 · foxglove.dev · its alternatives →
- 13
I couldn't find a simple way to explore the Brazilian startup ecosystem geographically, as I can in other places like the Bay Area or London, so I built one. The map currently includes hundreds of startups from Sao Paulo and their job opportunities. The most interesting thing I've learned so far is how clustered startup activity is in a handful of areas. I'd love to hear your thoughts. The EN version: https://www.startupsbr.com/sao-paulo
Jun 2026 · startupsbr.com · its alternatives →
- 14LT
2015 · linkurio.us · its alternatives →
- 15VM
Topological visualizations for the masses
2020 · topovis.iambeef.com · its alternatives →
- 16
 Tractorscope▲87
The developer’s data visualization platform
2024 · tractorscope.com · its alternatives →
- 17DV
2017 · dvblogger.com · its alternatives →
- 18

Visualize your Laravel app data in simple dashboards
2023 · its alternatives →
- 19SB
2017 · martin.varela.fi · its alternatives →
- 20

Reference tool for data visualisation
2016 · datavizcatalogue.com · its alternatives →
- 21

Global ESG data & Indicator for 10K+ firms & 100+ cryptos
2025 · ecovibesg.com · its alternatives →
- 22

Find the right data visualization tool: 291 charting libraries, maps, graph and network visualization, dashboards and more for JavaScript, Python, R and beyond, with live GitHub stars and activity.
18d ago · awesomedataviz.com · its alternatives →
- 23MG
2012 · guildwars2viz.com · its alternatives →
- 24MMapipedia▲61
A web platform I've written to make it easy for people to share goespatial time series data and display it on animated heatmaps. There's also a social media component that allows you to write comments, follow, share and like data sets that you want to engage with. You can also download the CSV data and embed animations into your own websites. People uploading datasets can also choose to make money by accepting donations. Please check out the home page for more details: https://mapipedia.com Here are some samples of things created with the platform (press the play button to start…
2019 · its alternatives →

Also compare
Ranked by how close each launch is in meaning, then by votes. Prices were read from each product’s own site when checked and can change. Refine with your own description →