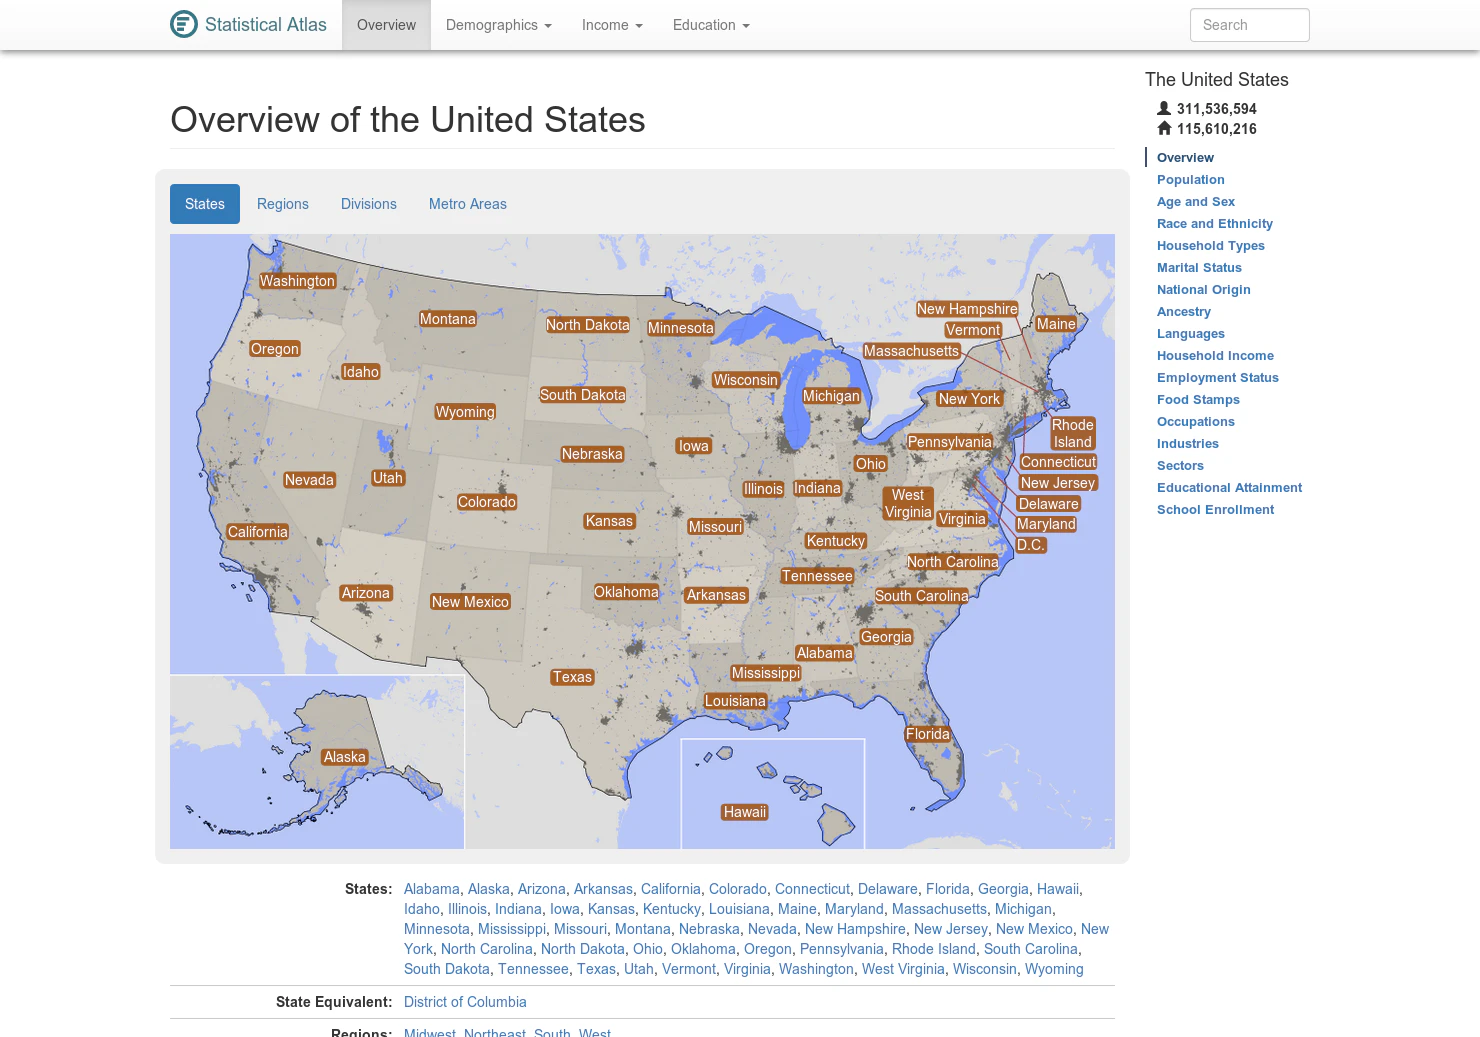
Infographic Showing HN Demographic-Income,Residence,Depression,Tech etc
Infographic Showing HN Demographic-Income,Residence,Depression,Tech etc launched on December 7, 2011 with 5 votes, #94 of 254 launches that month and more than 50% of that year's launches.
Does a similar job
all alternatives → A histogram of salaries given to H1B workers in the software industry2015 · swizec.github.io · ▲322
Since 2012 the US tech industry has sponsored 176,075 H1B work visas. With an average individual salary up to $39,465 above median household income.
- HHHistorical HN Hiring Data2023 · hnhiringtrends.com · ▲146
Hi HN! A few days ago I saw a graph[0] that showed the # of job postings on HN was declining. I started wondering what other trends I could glean from the data, so I created this! You can filter through the top level comments by keyword; for example you can filter by "remote" to see the massive spike around March 2020. Another interesting thing I found is that I can compare hiring across cities. I hope you enjoy! I made it so that the links to your search are sharable so if you have some interesting data you should be able to just link the page you're on! [0]…
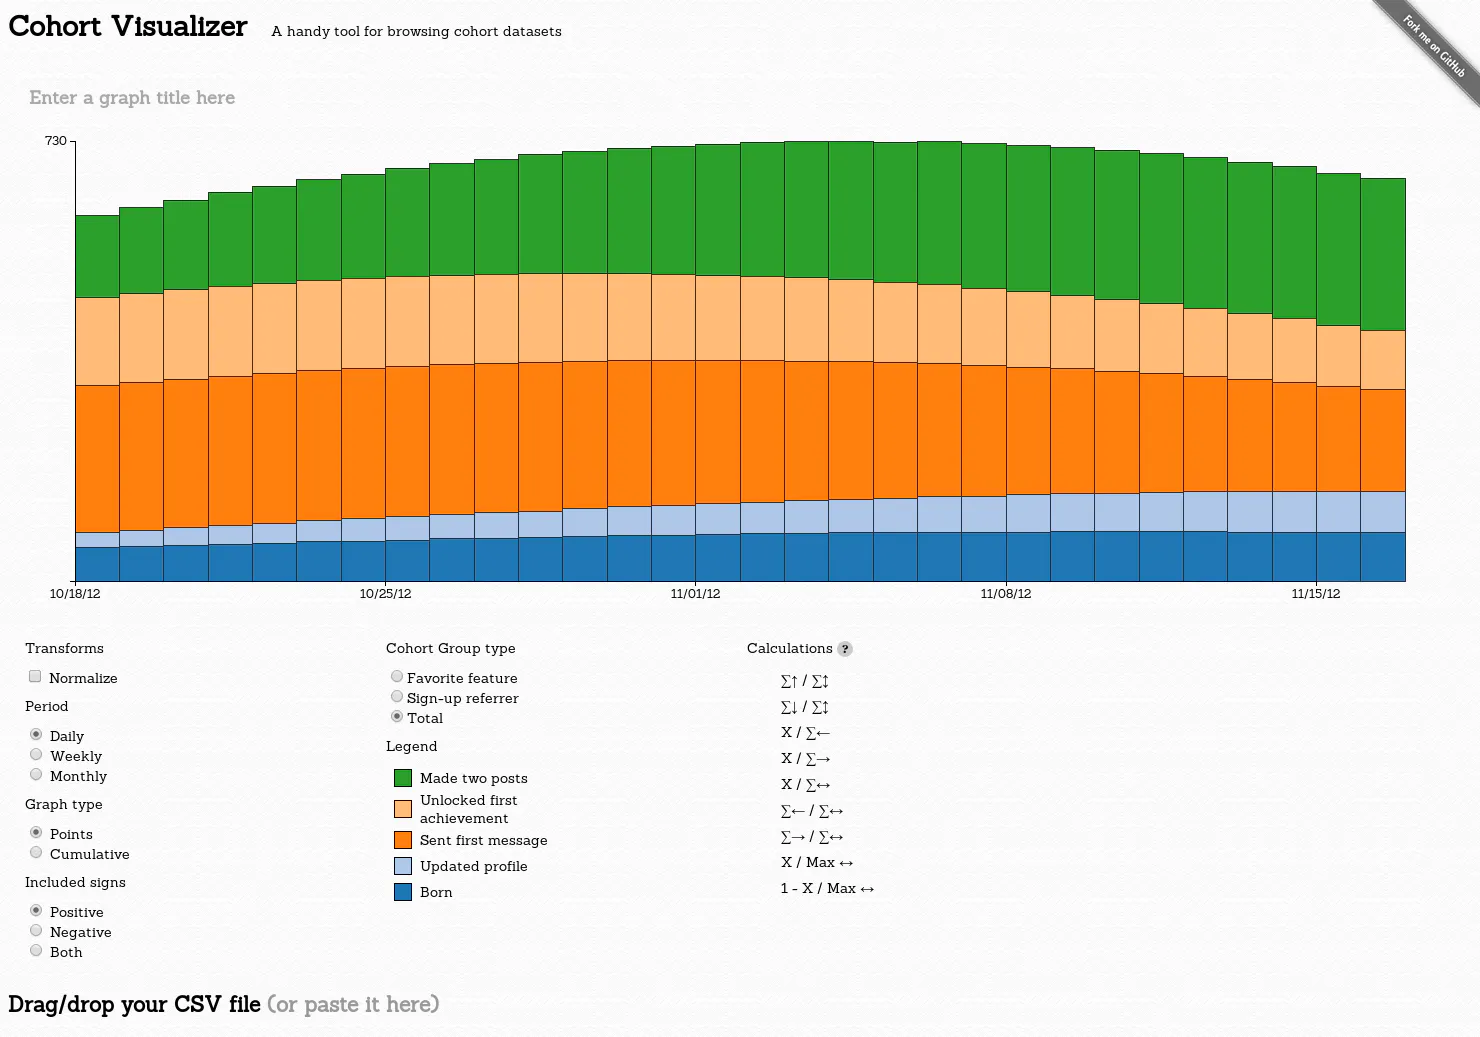
- VHvisualize HN polls by building charts2011 · hn-stuff.appspot.com · ▲5

More life & fun this month
the category →
A free city-building game in your browser. You are the mayor. You know what the city needs. Now get it past the zoning board, the neighbors, the appeals court and the next election.
Life & fun · 3d ago · permit.petercai.com
- IV
Life & fun · 16d ago · tanzaniaeducationproject.org

Turn a phone, tablet or TV into a sign. Type a message and it fills the screen: welcome signs, timers, Wi-Fi passwords and more. No app, no account, free.
Life & fun · 16d ago · bigwords.page

Play a free virtual guitar online with your keyboard or by touch. Slow songs down and see every chord, string and strum. Acoustic, classic, electric and bass.
Life & fun · 10d ago · guitoro.com

Carrier settings from iPhone, Pixel and Galaxy firmware, decoded and compared: APNs, VoLTE, 5G and Wi-Fi Calling per carrier, and what each build changed.
Life & fun · 14d ago · carrierexplode.com

Life & fun · 24d ago · space.bl2.net
Source: Show HN post ↗
Launched alongside, December 2011
the whole month →
The latest macOS offers the world’s best way to play — and add to — your collection of music, movies, TV shows, podcasts, audiobooks, and more.
Life & fun · 2011 · itunes.apple.com
- MZ
Life & fun · 2011 · anonysize.me
- BA
Life & fun · 2011 · hacksandthoughts.posterous.com
- WJ
Find information, resources and relevant links for subpug.com. This domain may be for sale.
Life & fun · 2011 · subpug.com

Life & fun · 2011 · github.com
- THThe Honeybadger▲147
Life & fun · 2011 · gethoneybadger.com