nowfound

AI · February 27, 2025

ST

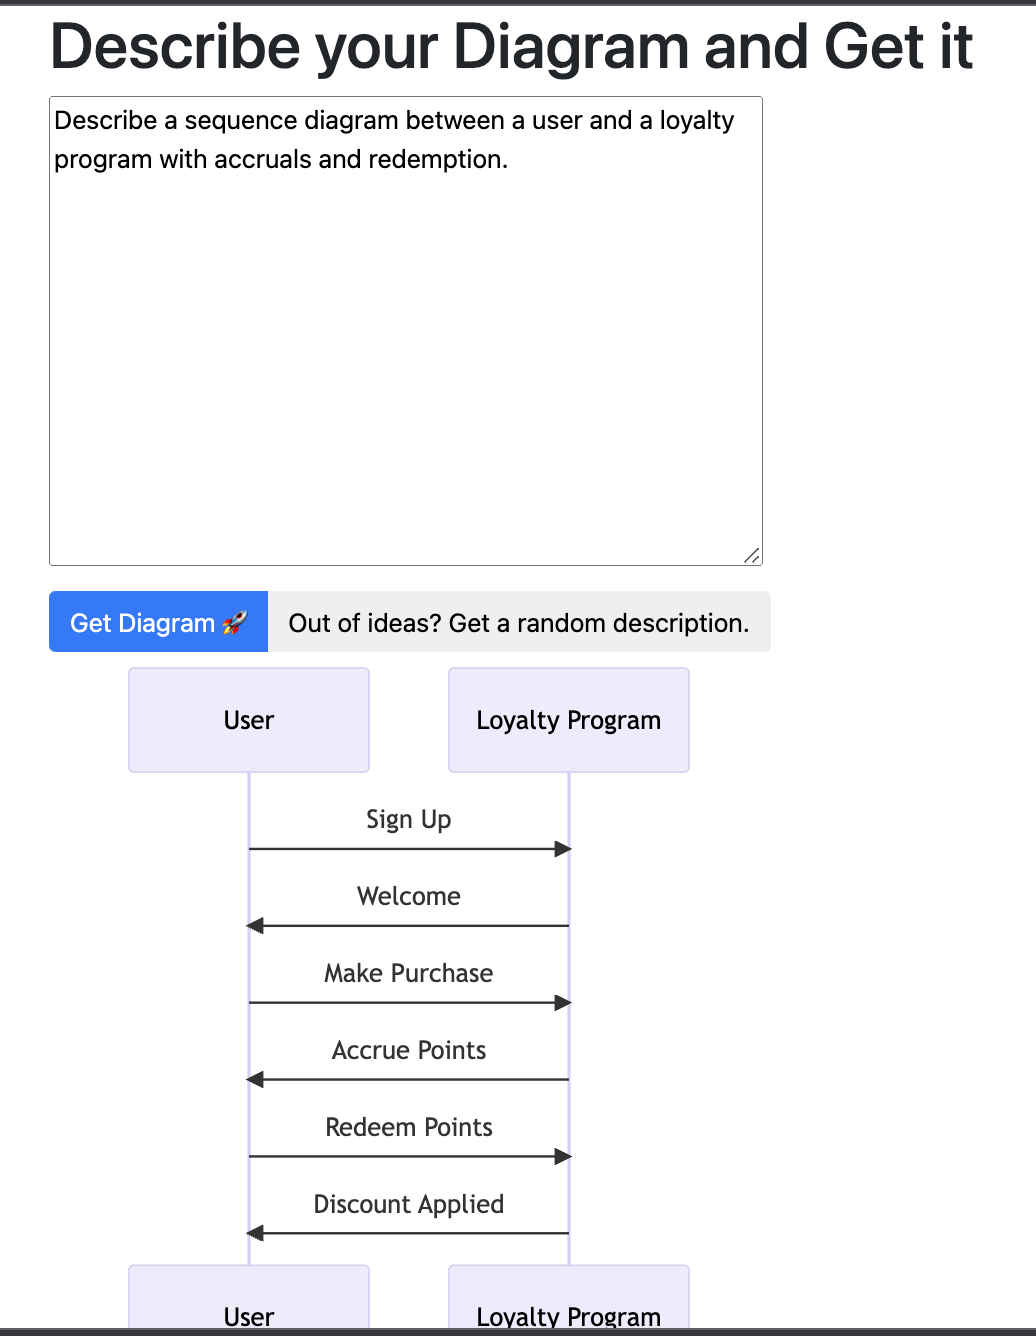
Splotch – Turn written workflows into live diagrams

IDEA Imagine how infuriating it would be if you had to write code in a text editor: no tools to diff changes; no organized way to merge changes from a new branch; no way to even see what's running on master. This is how we design, deploy and run most processes in every tech company: we describe them in text docs. Human memory and sense-making is visual and sequential. Stories and maps are sticky because they put information in context. We do sometimes use diagrams to show important processes because–unlike a text summary (especially LLM-generated summaries)--a diagram makes it easy to see…

What it does

In the maker’s words, at launch

IDEA Imagine how infuriating it would be if you had to write code in a text editor: no tools to diff changes; no organized way to merge changes from a new branch; no way to even see what's running on master. This is how we design, deploy and run most processes in every tech company: we describe them in text docs. Human memory and sense-making is visual and sequential. Stories and maps are sticky because they put information in context. We do sometimes use diagrams to show important processes because–unlike a text summary (especially LLM-generated summaries)--a diagram makes it easy to see the relationship between the steps. AI needs context windows. Humans need context maps: diagrams. We identified four things that could turn text into useful diagrams. These became our product requirements: WHAT THE TOOL DOES 1. Detect processes described in text. Not everything needs to be diagrammed. What’s the “skeleton” of the plan or process? 2. Auto-generate a diagram that’s close to the text description. Represent the core components as nodes, and link each node to its corresponding source text. 3. Keep the source text and diagram in sync. Most diagrams go “stale” quickly. “Live” diagrams stay current by linking each node to a snippet of text in a source doc. (Surprisingly, this didn’t exist until now!) 4. Edit, iterate and develop the diagram. Assume the process will evolve. Every change to one side (text or diagram) should cause a corresponding change on the other side. BUILDING IT Even when we started building last January, LLMs could output decent diagrams out of the box. But they were static, and we had to carefully examine both sides to figure out if the diagram was accurate. It wasn’t too hard to make the diagram editable, but once we made some manual edits (added and reorganized a few nodes) we ran into a big challenge: every AI edit changed the entire structure of the diagram so it was unrecognizable. Any manual changes were effectively lost. Was it possible to give users both AI editing and fine-grained manual controls? It was kind of like going back and forth between a WYSIWYG editor and HTML. The LLM just overrides manual work, like an editor overrides HTML. After months of experiments, we developed a protocol to translate text from the LLM into a data model that could be displayed in text or visual formats and an index that keeps the two views linked through iteration cycles. GRAPHS ARE HARD THO We still had a big, hairy problem: laying it all out. The LLM can parse the meaning of the input text, but then we need a graphing algorithm to arrange the nodes, determine spacing and draw the connections in a simple, human-readable way. LLMs are not equipped to deal with this kind of problem for visual output–especially when the output is changing over time. The diagrams were a mess. We started with Graphviz, but it got overwhelmed quickly. ReactFlow had good manual controls, but it didn’t offer a layout engine that could digest the LLM output. Mermaid and D3 had good layout algorithms, but they couldn’t handle manual editing. We spent the summer banging our heads against a wall churning through graphing engines. There’s a reason many PhD dissertations explore graph problems! Then we found YFiles. These folks have solved some really hard graphing problems and built a library that makes those capabilities usable. Unlike the graph tools above, they mostly serve enterprise customers with complex use cases–just what we needed to turn unpredictable LLM output into useful diagrams. With Yfiles, the final piece fell into place. FEEDBACK What do you want to do with it? We've plans for swimlanes and a bunch of embedded data so every graph shows the right level of detail. What would be useful?

Does the same job

all alternatives →
  • Splotch2025 · ▲44

    Turn written workflows into live diagrams

  • Code2Flow2019 · ▲255

    An easy solution to create product flows.

  • Diagrams for Mac2020 · ▲196

    A diagram editor for visualizing structures and processes

  • StoryMotionNov 2025 · ▲182

    Engaging Animated Diagrams, Flowcharts Made Easy

  • Code to Flow2023 · ▲122

    Visualize, analyze & understand your code flow

  • DiaChat2022 · ▲102

    Create and edit diagrams easily using natural language

More ai this month

the category →
  • I trained a 125M-parameter transformer to autocomplete piano performances in real time (~108 notes/sec on an iPhone 15). The idea is basically GitHub Copilot or Tabnine, except instead of prompting it with code, you prompt it by playing a few notes on a MIDI piano. The model then continues what you played, entirely on-device. The app is free if anyone wants to try it. Happy to answer questions about the model, training, Core ML, or the many things that didn't work.

    AI · 17d ago · simedw.com

  • Astute585

    Automate your B2B brand going viral, with new media creators

    AI · 18d ago · company-app.joinastute.com

  • Grok Bot547

    AI teammates that you can give real work to

    AI · 25d ago · x.ai

  • Hey HN, Henry from Cactus here! We previously released Cactus Needle, a 14MB agentic LLM for tool call, device use, and structured extraction for phones, wearables, smart homes, small robots and microcontrollers. We got really great feedback here, and have now incorporated the suggestions to release Needle 2. The whole model is a single 14MB binary that runs a full session in 28MB of RAM; 45m parameters at 2bit compression. Needle hits 500 tokens/sec decode speed on a Raspberry Pi 5, sits between 400-1,500 tokens/sec on VR devices like Meta Quest 3S and Apple Vision Pro, and ranges…

    AI · 26d ago · cactuscompute.com

  • Make your software self-driving

    AI · 30d ago · coldtea.ai

  • Soloop472

    Approval-first Agent OS for solo founders

    AI · 30d ago · soloop.io

Launched alongside, February 2025

the whole month →
  • Beautiful screen recordings with instant shareable links

    Growth · 2025 · screen.studio

  • Tana1,666

    Put your notes to work with voice and AI

    AI · 2025 · tana.inc

  • IG

    I was at FB/Meta from late 2013 to early 2023, mostly working in the compiler/runtime spaces. I got hit in the spring 2023 layoff wave. I immediately started making games in my newfound free time (a lifelong interest, and I even worked in AA(A?) back ca. ~2000), and in October 2023 I stumbled upon the idea of a roguelike pachinko/plinko game inspired by Luck Be A Landlord. Things snowballed quickly, I started talking to publishers, then worked like crazy through all of 2024, almost the hardest I've ever worked in my career, and launched the game in December 2024. It's sold…

    Work · 2025

  • Tanka1,410

    AI Messenger with smart reply & long term memory for teams

    AI · 2025 · tanka.ai

  • Tool Finder1,327

    Your shortcut to better software

    AI · 2025 · toolfinder.com

  • IB

    i wanted to change the habit of reaching for my phone in the morning and doomscrolling away an hour so i built an app to help me. now i have to literally touch grass before accessing my most distracting apps the app is built in swiftui, uses the screen time apis provided by apple and google vision to recognise grass or not i'd love to get your thoughts on the concept.

    Life & fun · 2025 · touchgrass.now