Life & fun · alternatives · 2026
24 alternatives to Markov chains explained visually
Markov Chains Explained Visually is an interactive educational tool that demonstrates how Markov chains work through visual demonstrations and examples. It's designed for students and anyone interested in understanding… Below are 24 products that do a similar job, ranked by how close each is in meaning and then by launch-day votes. Markov chains explained visually launched in 2014; newer entries below may have overtaken it.
- 1

Visual explanations of Algorithms and Data structures
2020 · chrislaux.com · its alternatives →
- 2

Generating fun Stack Overflow and Stack Exchange Questions using Markov Chains
2018 · se-simulator.lw1.at · its alternatives →
- 3DE
2015 · lewis500.github.io · its alternatives →
- 4IT
Experiments in expressing statistical thinking with interactive design
2015 · r2d3.us · its alternatives →
- 5VG
2020 · treksit.netlify.app · its alternatives →
- 6

A compact C++ library for easily simulating common Markov processes. - GitHub - NathanEpstein/markov: A compact C++ library for easily simulating common Markov processes.
2015 · github.com · its alternatives →
- 7

Interactive solver for the traveling salesman problem to visualize different algorithms. Includes various Heuristic and Exhaustive algorithms.
2019 · tspvis.com · its alternatives →
- 8AV
2012 · bost.ocks.org · its alternatives →
- 9

xkcd styled chart lib. Contribute to timqian/chart.xkcd development by creating an account on GitHub.
2019 · github.com · its alternatives →
- 10IM
Permutation Test: Visual Explanation
2019 · jwilber.me · its alternatives →
- 11
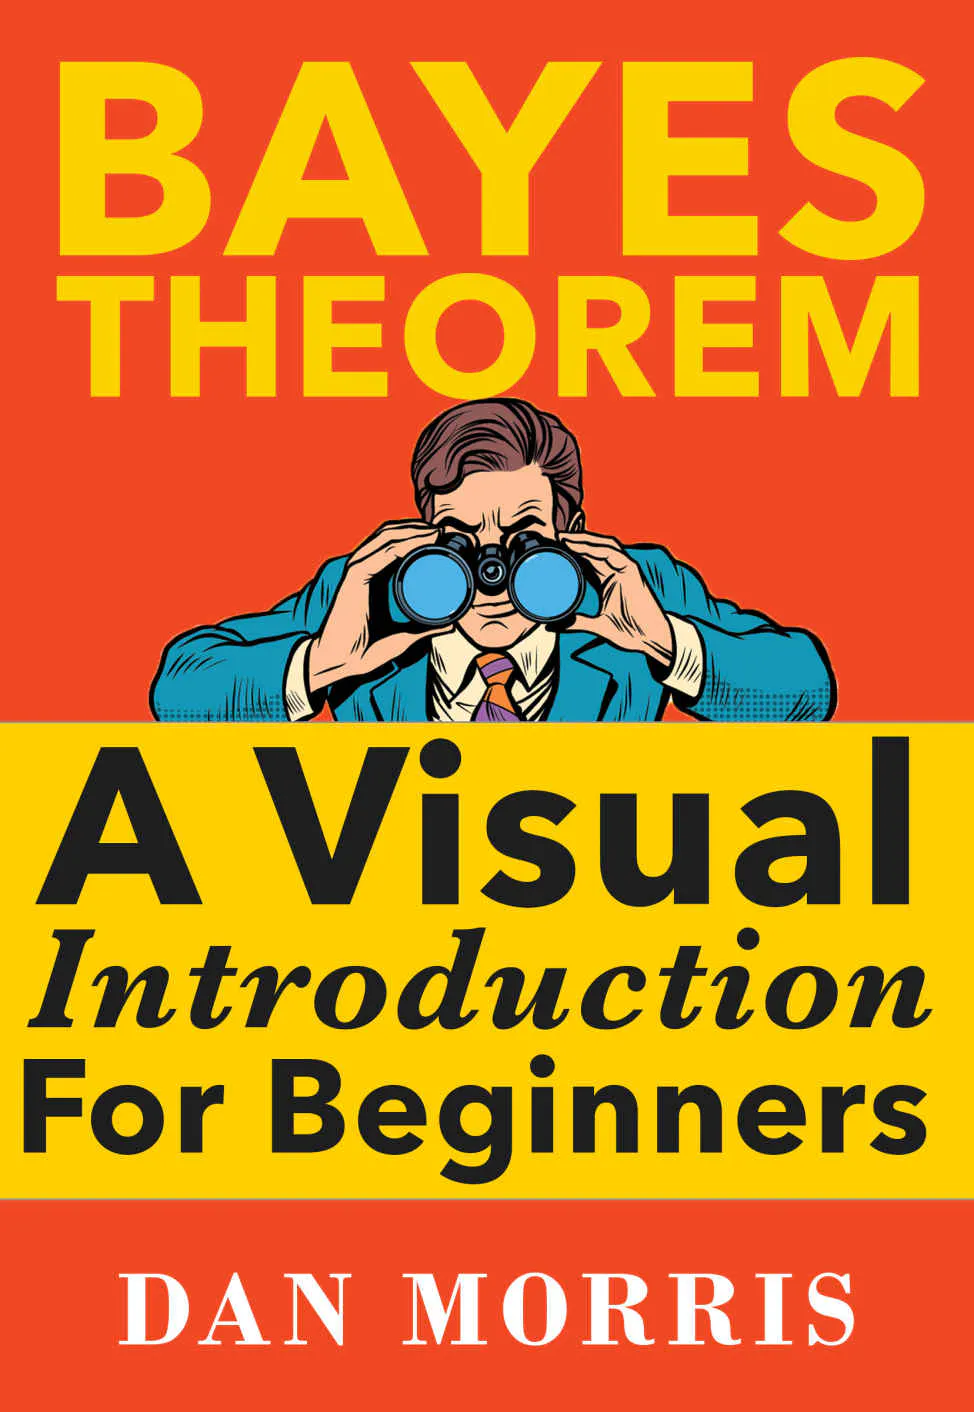
A beginners visual approach to Bayesian data analysis
2017 · amazon.com · its alternatives →
- 12
A visual introduction to probability and statistics 📊
2017 · students.brown.edu · its alternatives →
- 13AC
I started to draw cartoons to make complex concepts in AI more accessible to the rest of us. Hope this is useful & lmk if you have ideas or feedback!
2024 · ai-explained.yoko.dev · its alternatives →
- 14

- 15MT
2016 · demos.samgentle.com · its alternatives →
- 16AI
2023 · x0axz.com · its alternatives →
- 17MB
Growth at Anthropic. Previously Growth Engineering leader at MasterClass and Opendoor.
2012 · alexeymk.com · its alternatives →
- 18

Markov Chain Twitter Bot generator. Contribute to EivindArvesen/dankenstein development by creating an account on GitHub.
2018 · github.com · its alternatives →
- 19IQ
A propos de Mastalab
2017 · illustrated-algorithms.now.sh · its alternatives →
- 20

heyo! Explainpaper lets you upload a research paper PDF. If you don't understand a formula or sentence, just highlight it and the tool explains it for you I built this a few weeks ago to help me read a neuroscience paper, and it works pretty well! I didn't fine-tune GPT-3, but I do take a lot of context from the paper and feed that into the prompt (not the whole paper). Ppl have uploaded AI, biology, economics, philosophy papers and even law documents. Works in Chinese, Japanese, Spanish, French and more as well!
2022 · explainpaper.com · its alternatives →
- 21

Interactive visualisations help explain Depth First Search and Breadth First Search as well as algorithms based upon each approach. A very useful resource for learning by seeing.
2016 · workshape.github.io · its alternatives →
- 22

Swimlanes.io is a simple free online tool for making sequence diagrams
2017 · swimlanes.io · its alternatives →
- 23

A simple Python debugger and profiler that generates animated visualizations of program flow, useful for algorithm learning. - CCExtractor/vardbg
2020 · github.com · its alternatives →
- 24

Graphic is a grammar of data visualization and Flutter charting library, with there features: - A Grammar of Graphics: Graphic derives from Leland Wilkinson's book The Grammar of Graphics, and tries to balance between theoretical beauty and practicability. It inherits most concepts, like the graphic algebra. - Declarative and Reactive: As is encouraged in Flutter, the chart widget of Graphic is declarative and reactive. The grammar of data visualization is implemented by a declarative specification and the chart will reevaluate automatically on widget update. - Interactive: With the signal…
2023 · github.com · its alternatives →
Also compare
- Collection of animated algorithms and data structures alternatives
- Generating fun Stack Exchange questions using Markov chains alternatives
- Differential Equations Explained alternatives
- Intro to Machine Learning in Interactive D3.js Visualizations alternatives
- Visualize Graph Theory alternatives
- Markov – A compact C++ library to easily simulate Markov processes alternatives
Ranked by how close each launch is in meaning, then by votes. Prices were read from each product’s own site when checked and can change. Refine with your own description →