Growth · alternatives · 2026

24 alternatives to scatterplot.online
Easy way to make scatter plots from Excel or CSV data.
Below are 24 products that do a similar job, ranked by how close each is in meaning and then by launch-day votes. scatterplot.online launched in 2017; newer entries below may have overtaken it.
- 1

I often needed to make simple scatter plots without opening Excel, so I built a small tool.
2025 · scatterplotmaker.com · its alternatives →
- 2

- 3

Free chart maker & visual exploration for spreadsheet data
2020 · its alternatives →
- 4

Use CSV to Graph Online to upload or paste CSV data and create line charts, bar charts, scatter plots, and CSV visualizations for free.
Jun 2026 · csv.qingyanglabs.com · its alternatives →
- 5
One-click AI data explorer - Supercharge your data stories
2025 · scatterplot.ai · its alternatives →
- 6VO
Hello HN. I've always found writing data visualisation scripts boring and repetitive in data science workflows earlier in my career, so I built this tool to automate it. The available methods are based on my experience in econometrics where histograms and scatterplots were the starting points to check data distributions. The link is to the documentation and the app is freely available at https://visprex.com, and if you're curious about the implementation it's open source at https://github.com/visprex/visprex. I'd appreciate any comments and feedback!
2024 · docs.visprex.com · its alternatives →
- 7
- 8

- 9

Hey HN! We are Jonathan & Guy, and we are happy to share a project we’ve been working on. ChartDB is a tool to help developers and data analysts quickly visualize database schemas by generating ER diagrams with just one query. A unique feature of our product is AI-Powered export for easy migration. You can give it a try at https://chartdb.io and find the source code on GitHub. Next steps ---> More AI. We’d love feedback :)
2024 · github.com · its alternatives →
- 10
 Autoplot▲97
Unify data analysis and plotting in one powerful workspace
Jul 2026 · autoplot.ai · its alternatives →
- 11
 DataSquirrel.ai▲268
Fastest way: csv/xls to dashboard report, no ChatGPT upload
2023 · datasquirrel.ai · its alternatives →
- 12
 CSV Plot▲6
Turn Your CSV Data into Insights in Seconds.
Jan 2026 · csvplot.netlify.app · its alternatives →
- 13

Point & click to make a scatterplot data set, then output it
2016 · robertgrantstats.co.uk · its alternatives →
- 14

Convert spreadsheets to web pages with formula support, right from within Excel. No coding required.
2019 · publisheet.com · its alternatives →
- 15
 Plottable.js▲132
Flexible, interactive charts for the web.
2016 · plottablejs.org · its alternatives →
- 16

The ultimate tool for automated marketing reporting in Excel
2019 · supermetrics.com · its alternatives →
- 17CP
2012 · excharts.com · its alternatives →
- 18
 Vizician▲77
Drag & drop your data for instant visual data exploration
2022 · vizician.com · its alternatives →
- 19
- 20

Beautiful charts, slides & KPI cards. AI-powered & 100% free
Dec 2025 · prettychart.app · its alternatives →
- 21
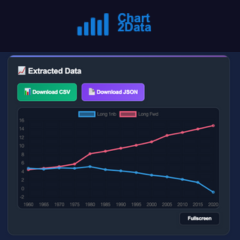 Chart2Data▲15
Turn any chart into clean, usable data in seconds with AI
2025 · chart2data.com · its alternatives →
- 22

- 23

I built a simple tool that converts CSV files into graphs instantly. The idea came from seeing how much time people spend opening spreadsheets or writing code just to visualize data. I wanted something where you can just upload a CSV and get charts immediately. It currently supports quick line and basic chart visualizations from CSV datasets. I’d really appreciate feedback from people who work with data or frequently analyze CSV files.
Mar 2026 · plotiq-web.web.app · its alternatives →
- 24

Just wanted to share with HN a simple/minimal open source Python library that generates SVG files visualizing two dimensional data and distributions, in case others find it useful or interesting. I wrote it as a fun project, mostly because I found that the standard libraries in Python generated unnecessarily large SVG files. One nice property is that I can configure the visuals through CSS, which allows me to support dark/light mode browser settings. The graphs are specified as JSON files (the repository includes a few examples). It supports scatterplots, line plots, histograms,…
Mar 2026 · github.com · its alternatives →


Also compare
Ranked by how close each launch is in meaning, then by votes. Prices were read from each product’s own site when checked and can change. Refine with your own description →