Life & fun · alternatives · 2026

24 alternatives to Visualizing World Birth and Death Rates
World births and deaths, simulated in real-time on a map
Below are 24 products that do a similar job, ranked by how close each is in meaning and then by launch-day votes. Visualizing World Birth and Death Rates launched in 2015; newer entries below may have overtaken it.
- 1
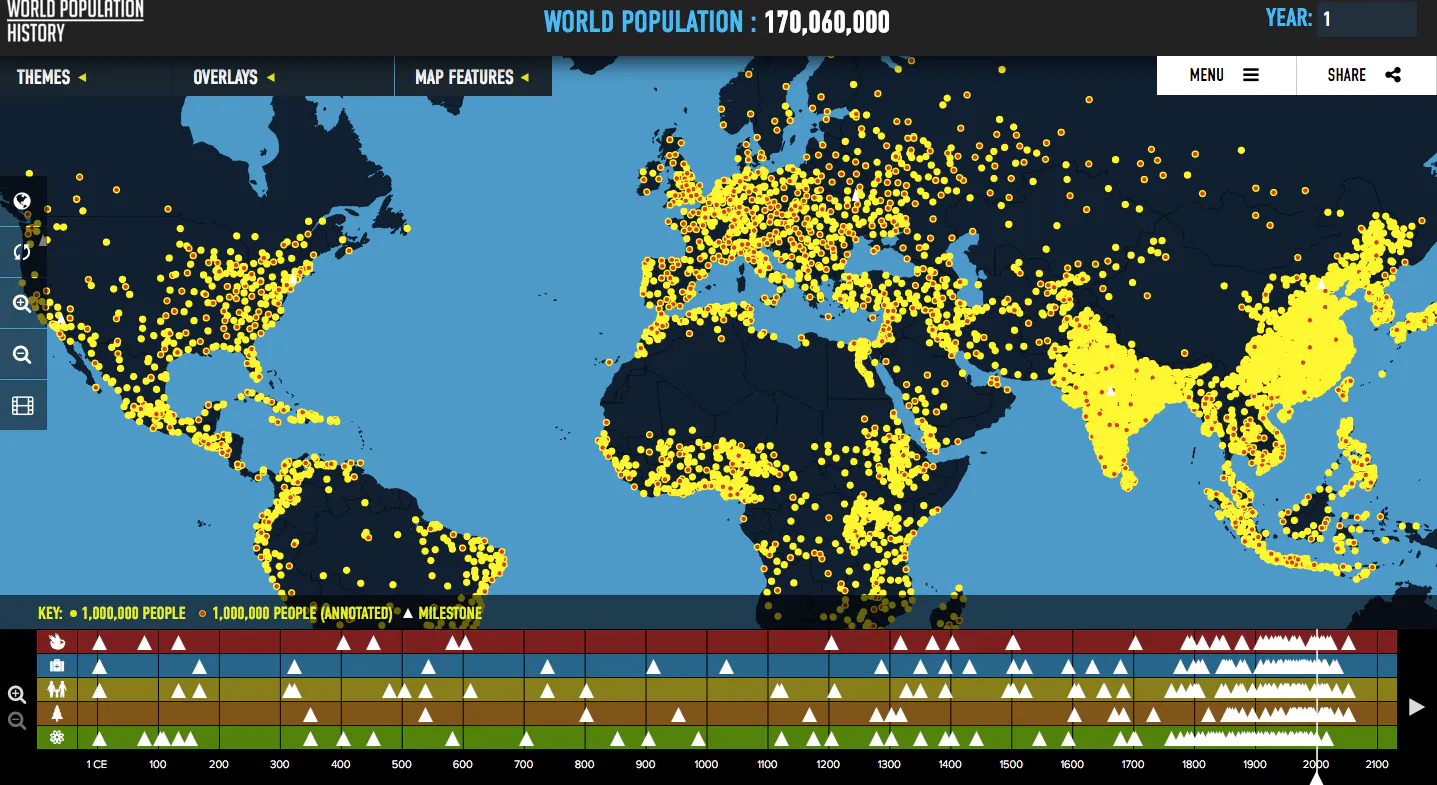
Visualizes global population trends over the last two thousa
2016 · worldpopulationhistory.org · its alternatives →
- 2

Your life in numbers and dates. How long will you live?
2015 · population.io · its alternatives →
- 3
- 4
 TimeMap▲325
Interactive Map of History: millions of people, events, maps
2024 · oldmapsonline.org · its alternatives →
- 5
 Histography.io▲157
Interactive history timeline from the Big Bang to 2015.
2015 · histography.io · its alternatives →
- 6

Real-time infographic of lovers connecting around the world
2014 · its alternatives →
- 7
 Premise▲79
Tracking real-time macroeconomic & human development trends
2014 · premise.com · its alternatives →
- 8
 Odyssey 3▲159
A world model that simulates physics in real time
14d ago · odyssey.systems · its alternatives →
- 9WP
2014 · roadtolarissa.com · its alternatives →
- 10

Explore the distribution and dynamics of global homicides
2015 · homicide.igarape.org.br · its alternatives →
- 11TT
Simulate anything on a map from a text prompt -- and conduct risk analysis against LiveUA map's global realtime data points from social media and news sources. I trained a GPT-2-size model on historical incident data used to predict things that will go wrong. As historian Benjamin Breen mentions, the leading language models are good historians, so the application will simulate historical events pretty well also. I include a Multi-Agent RL Urban Mobility model in progress displayed on the map as small white cubes representing traffic and pedestrians. Around SF, it uses real census data and…
2025 · mused.com · its alternatives →
- 12

A web publication showcasing empirical research and data
2016 · ourworldindata.org · its alternatives →
- 13

A map of events & projects in the global GraphQL community
2017 · graphql-world.com · its alternatives →
- 14

- 15

- 16
- 17
 Epoch▲95
A general purpose library for building real-time charts.
2014 · fastly.github.io · its alternatives →
- 18

- 19MR
2013 · matthewisabel.com · its alternatives →
- 20

Visualizing the extraordinary Big Data revolution
2015 · lightshow.lol · its alternatives →
- 21
- 22

- 23

Mapping the future of human civilisations from Asia to US
2016 · blcw.me · its alternatives →
- 24

Innovation, Global Challenges & Asia Healthcare
2015 · analysepodcast.com · its alternatives →
Also compare
Ranked by how close each launch is in meaning, then by votes. Prices were read from each product’s own site when checked and can change. Refine with your own description →