Work · alternatives · 2026
24 alternatives to We created a tool to visualize scientific knowledge
I posted our project a few days ago in a thread about Vitamin D. We’ve made some UI improvements people might find interesting.
This tool visualizes scientific knowledge with an interactive interface. It helps researchers and students explore complex scientific topics by presenting information in a visual format. The creators recently improved… Below are 24 products that do a similar job, ranked by how close each is in meaning and then by launch-day votes. We created a tool to visualize scientific knowledge launched in 2022; newer entries below may have overtaken it.
- 1
 Sage Project▲226
Beautiful visualization of nutritional facts 🍟🍉🌮
2016 · sageproject.com · its alternatives →
- 2

Understanding scientific articles can be tough, even in your own field. Trying to comprehend articles from others? Good luck. Enter, Now I Get It! I made this app for curious people. Simply upload an article and after a few minutes you'll have an interactive web page showcasing the highlights. Generated pages are stored in the cloud and can be viewed from a gallery. Now I Get It! uses the best LLMs out there, which means the app will improve as AI improves. Free for now - it's capped at 20 articles per day so I don't burn cash. A few things I (and maybe you will) find interesting: * This is…
Feb 2026 · nowigetit.us · its alternatives →
- 3

Create pro-level graphs that drive actions
2024 · graphy.app · its alternatives →
- 4IT
Experiments in expressing statistical thinking with interactive design
2015 · r2d3.us · its alternatives →
- 5

Ideas, issues, knowledge, data — visualized!
2015 · informationisbeautiful.net · its alternatives →
- 6
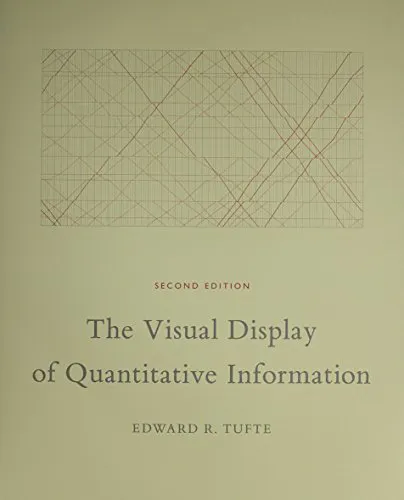
The bible for people interested in presenting information
2015 · amazon.com · its alternatives →
- 7
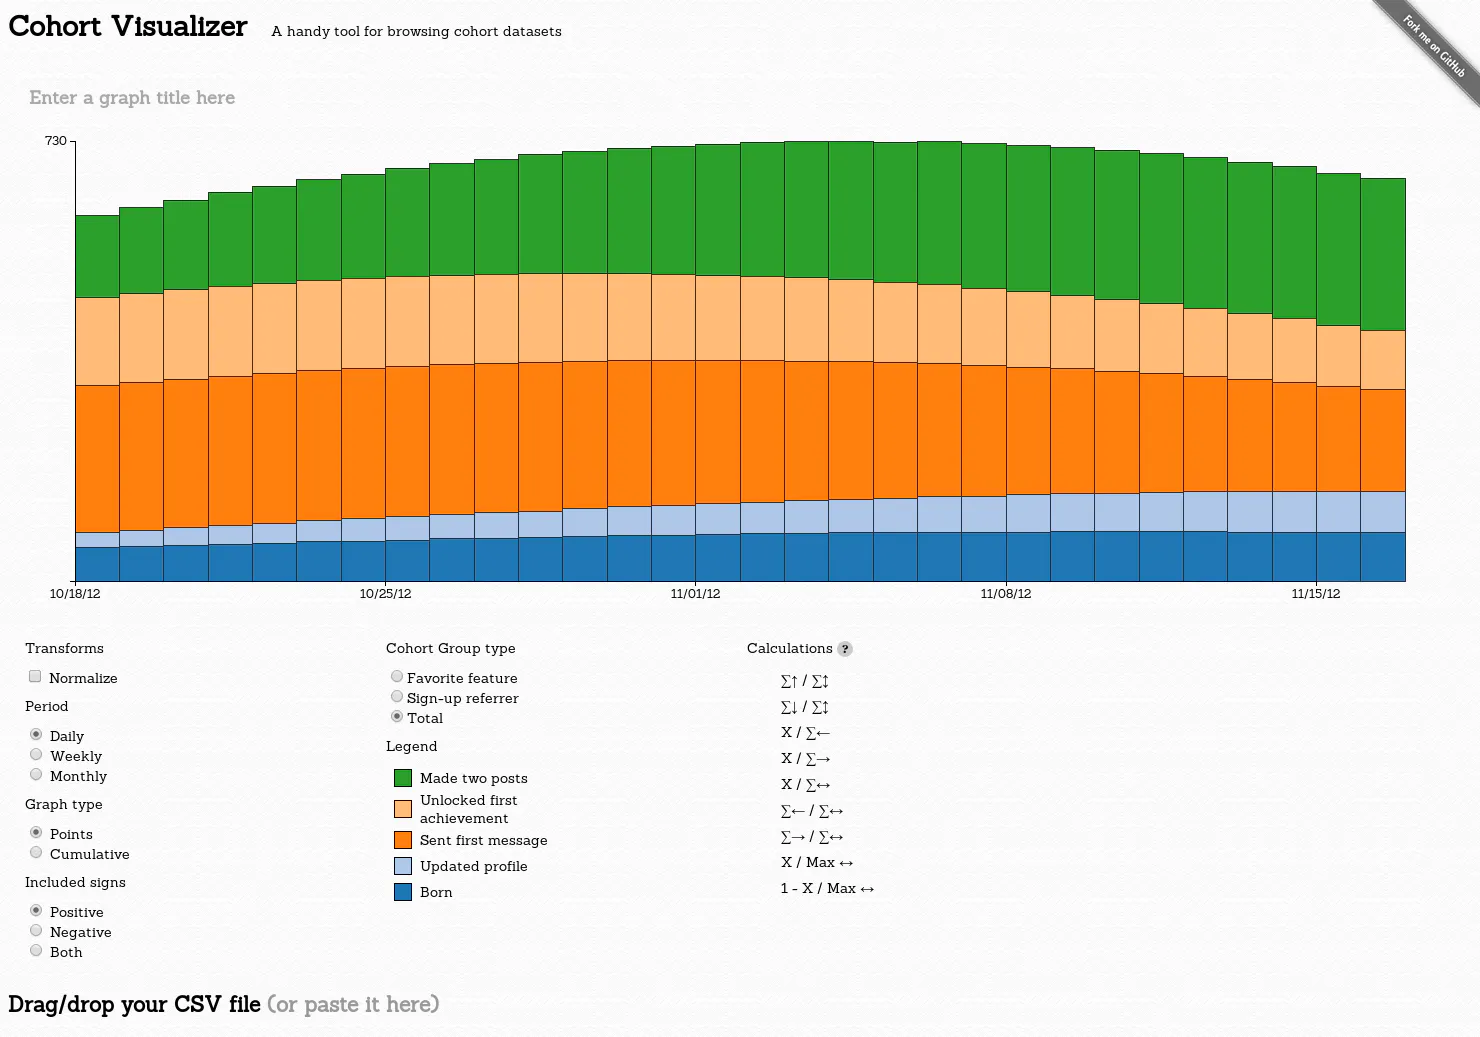
A handy tool for browsing cohort datasets
2014 · bslatkin.github.io · its alternatives →
- 8
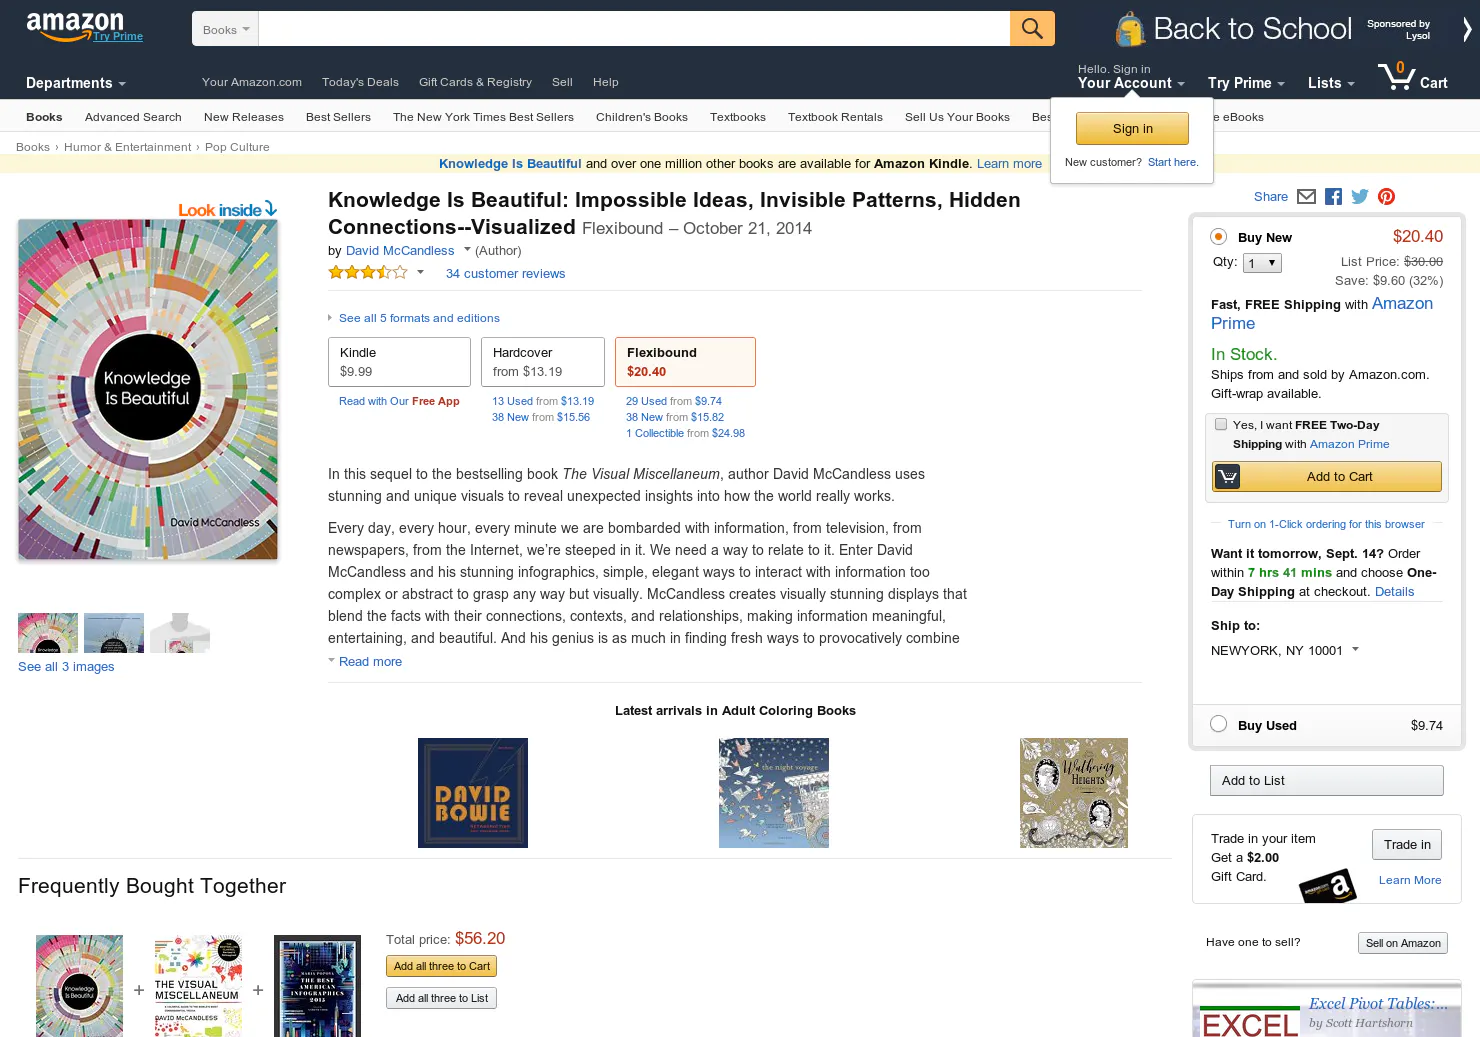
Taking infographics & data-visualisation next level (book)
2014 · amazon.com · its alternatives →
- 9

When I read papers, I have to jump between multiple tabs to find the dataset, code, videos, peer reviews, and so on. I tried to fix this with this project. It started as a project just for papers on arXiv, but after its initial success on Twitter (got like 1.9k views: the most I have gotten for a post), I have now expanded it to include other openly available papers from PubMed Central, bioRxiv, medRxiv, and eLife. These papers have been linked with their genes, proteins, diseases, drugs, clinical trials, 3D protein structures, code, and cited and similar papers. This project now has four…
Jul 2026 · tomesphere.com · its alternatives →
- 10VG
2020 · treksit.netlify.app · its alternatives →
- 11

Hi HN! I've found this visualization tool immensely helpful over the years for getting an intuition for how an LLM "sees" some piece of text, and with a bit of elbow grease decided to move all compute to client side so I could make it publicly available. I've found it particularly useful for - Understanding exactly how repetition and patterns affect a small LM's ability to predict correctly - Understanding different tokenization patterns and how it affects model output - Getting a general sense of how "hard" different prediction tasks are for GPT-style models Known problems (that I probably…
2023 · perplexity.vercel.app · its alternatives →
- 12MO
2018 · anvaka.github.io · its alternatives →
- 13

- 14ND
2014 · blog.spritesapp.com · its alternatives →
- 15

- 16

The network graph that holds all the wonderful reads I've ever found on the internet.
2022 · prashantbarahi.com.np · its alternatives →
- 17

- 18
 Productverse▲138
Interactive visualization of best product management tools
2020 · theproductverse.com · its alternatives →
- 19

Reference tool for data visualisation
2016 · datavizcatalogue.com · its alternatives →
- 20

Catalog of all chart types and tools to build them
2017 · visualizationuniverse.com · its alternatives →
- 21

- 22

A guide for anyone who works with data
2017 · leanpub.com · its alternatives →
- 23IV
2012 · exploringdata.github.com · its alternatives →
- 24
 vizGPT▲80
Make contextual data visualization with Chat interface
2023 · vizgpt.ai · its alternatives →
Also compare
- Sage Project alternatives
- Now I Get It – Translate scientific papers into interactive webpages alternatives
- Graphy for Data Storytelling alternatives
- Intro to Machine Learning in Interactive D3.js Visualizations alternatives
- Information is Beautiful alternatives
- The Visual Display of Quantitative Information alternatives
Ranked by how close each launch is in meaning, then by votes. Prices were read from each product’s own site when checked and can change. Refine with your own description →