We created a tool to visualize scientific knowledge
I posted our project a few days ago in a thread about Vitamin D. We’ve made some UI improvements people might find interesting.
We created a tool to visualize scientific knowledge launched on November 20, 2022 with 10 votes, #1,252 of 3,471 launches that month and more than 75% of that year's launches.
In plain words
This tool visualizes scientific knowledge with an interactive interface. It helps researchers and students explore complex scientific topics by presenting information in a visual format. The creators recently improved the user interface based on community feedback. The project originated from a discussion about Vitamin D and has since expanded its scope to cover broader scientific domains.
written from the facts on this page · September 2026
Does a similar job
all alternatives →
 Now I Get It – Translate scientific papers into interactive webpagesFeb 2026 · nowigetit.us · ▲305
Understanding scientific articles can be tough, even in your own field. Trying to comprehend articles from others? Good luck. Enter, Now I Get It! I made this app for curious people. Simply upload an article and after a few minutes you'll have an interactive web page showcasing the highlights. Generated pages are stored in the cloud and can be viewed from a gallery. Now I Get It! uses the best LLMs out there, which means the app will improve as AI improves. Free for now - it's capped at 20 articles per day so I don't burn cash. A few things I (and maybe you will) find interesting: * This is…
- ITIntro to Machine Learning in Interactive D3.js Visualizations2015 · r2d3.us · ▲128
Experiments in expressing statistical thinking with interactive design
 Information is Beautiful2015 · informationisbeautiful.net · ▲102
Ideas, issues, knowledge, data — visualized!
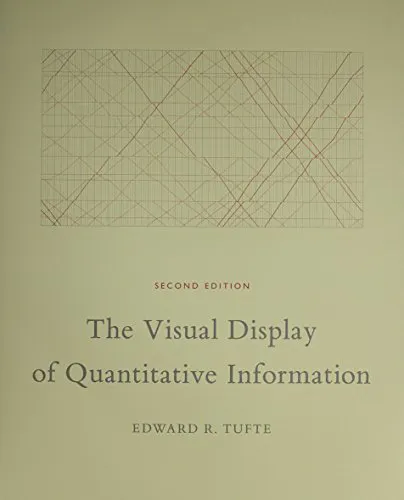 The Visual Display of Quantitative Information2015 · amazon.com · ▲57
The bible for people interested in presenting information
More work this month
the category →
Endless lofi beats composed live in your browser, over pixel-art nights in Paris, Tokyo, New York, Hong Kong, Sydney, San Francisco and more. Free, no sign-up.
Work · 24d ago · loficities.com
 Smooth Recorder▲257
Mac screen recordings that look edited when you hit stop
Work · 18d ago · smoothrecorder.com


Work · 12d ago · readrare.com
Source: Show HN post ↗
Launched alongside, November 2022
the whole month →


I made a thing! In 2014, I was holding a stack of iPhones and thought to myself: "Hey, if I had each phone display a playing card, I could click a button and they'd shuffle themselves" I pared that idea all the way down to this: trading cards made of e-ink displays. Right now, each card costs me about $20 each, but with only a bit more scale, I think I can get that down to $10. In doing this project, I learned how to design electronics and circuit boards. I learned Rust and wrote my first driver, I upped my CAD skills, 3D printed, and did my first resin casting. I generated the images on the…
Dev tools · 2022 · wyldcard.io