Dev tools · alternatives · 2026

24 alternatives to Can you spot the better chart?
I've been using Matplotlib for years and even created python-graph-gallery.com to help people quickly build charts with Python. However, I’ve always struggled to grasp the "big picture" of how everything fits together. That's why I'm now working on a new project called Matplotlib Journey, and I’d love to get your feedback! My goal is to explain everything from scratch, so anyone can gain a true understanding of how this essential library works.
Below are 24 products that do a similar job, ranked by how close each is in meaning and then by launch-day votes.
- 1

Create pro-level graphs that drive actions
2024 · graphy.app · its alternatives →
- 2

Many JS libraries exist to build graphs on the web (Vega, chartJS, Plotly...). They allow to make charts quickly. But you lose flexibility: you're limited by the options they offer. I just created a gallery with hundreds of graphs made with d3.js and React. - Examples are split by graph types - They all come with explanation and code sandboxes - Gradual complexity to ease the learning curve It took me ages to create this project! Feedback welcome!
2023 · react-graph-gallery.com · its alternatives →
- 3
 Graphy Lite▲671
The best way to create & share charts on the internet
2023 · visualize.graphy.app · its alternatives →
- 4

An awesome iTerm2 backend for Matplotlib, so you can plot directly in your terminal. - daleroberts/itermplot
2017 · github.com · its alternatives →
- 5
 Charts▲348
The most comprehensive collection of charts for Sketch
2019 · charts.graphics · its alternatives →
- 6

I see so many beautiful charts made with R. And not that many made with Python. So I wanted to prove that it was doable with Python too! I wrote 22 tutorials to create stunning charts I love with Matplotlib. Why are R people creating more polished charts??
2023 · python-graph-gallery.com · its alternatives →
- 7GA
Hi everyone! Graphs is the intersection of data visualization and the daily web puzzle genre (Wordle, NYT Mini Crossword, Connections, etc.). Every day, you are given a nameless graph and 5 options to select the right dataset it is representing. Upon winning, you can access the underlying dataset and other info + maintain a streak and stats. It's super simple - check out today's chart and you should be able to get the gist quickly. My email + twitter account (@graphsgame) is on the page, would love a feedback or a follow. Don't hesitate to reach out!
2024 · graphs.world · its alternatives →
- 8

I've been iterating on a small galaxy visualization project that originally started as a university course assignment, using only provided sample data (no real astronomical distances). Recently, I updated it to include redshift-based distance data, which makes the 3D structure more meaningful and closer to real large-scale galaxy distributions. Repo: https://github.com/Avicted/galaxy_visualization_raylib Demo video (3D navigation + galaxy structures): https://www.youtube.com/watch?v=fC83RDWuPvw Current state: - Written in C (C99 standard) using Raylib -…
2024 · github.com · its alternatives →
- 9

- 10
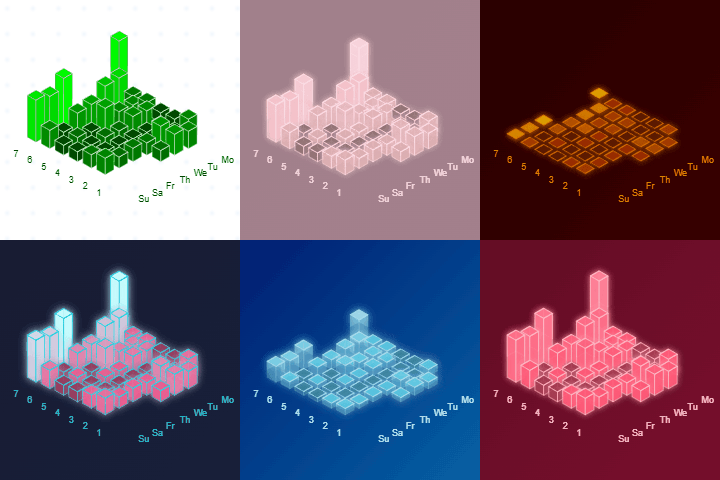
Visualize your weekly activity on Bluesky in a 3D chart
2025 · bluesky-3d-graph.vercel.app · its alternatives →
- 11

- 12VG
2020 · treksit.netlify.app · its alternatives →
- 13

Hello HN, It has been a while since I contributed to the web, so I decided to get back in shape and publish "something". This app is a POC of "what if diagrams were more dynamic". I'm a software engineer by trade, and with conventional tools, I often times struggle to explain flows of data in complex software systems. I got inspired by video games like The Incredible Machine and Factorio, as in some ways, software systems tend to become Rube Goldberg-esque machines ;) As a side quest, I also wanted to craft diagrams faster than text-based tools (ex: mermaid), as I am always forgetting their…
2024 · github.com · its alternatives →
- 14

Catalog of all chart types and tools to build them
2017 · visualizationuniverse.com · its alternatives →
- 15SI
Hi All, I would like to share with you a new Python package for interactive decision tree visualization. It is called `supertree`. It visualizes decision tree as interactive graph, where you can collapse and expand selected nodes. You can zoom and pan though large trees. It works with Scikit-learn, Xgboost, and LightGBM. The package works in notebooks: Jupyter Lab, Jupyter Notebook, Google Colab. You can also use it in Python scripts and save output trees to HTML. The package is available on pip: `pip install supertree`. You can find code examples on the GitHub:…
2024 · its alternatives →
- 16

A simple Python debugger and profiler that generates animated visualizations of program flow, useful for algorithm learning. - CCExtractor/vardbg
2020 · github.com · its alternatives →
- 17BG
https://github.com/temataro/better-graphs I want to teach good Matplotlib taste to agents and humans. This repo contains: 1. Agent instructions + design motifs (Claude Code skills + a CLAUDE.md). 2. An online "blog" tutorial of the same skills, for people. 3. minerva.mplstyle, my opinionated sane matplotlib defaults. Inspired by Tufte's book: The Visual Display of Quantitative Information (a gift from my boss!), plus data-to-viz.com and the python-graph-gallery. Aiming for halfway to the gorgeous plots in the paid matplotlib-journey.com, but free and open to share with…
Jun 2026 · temataro.github.io · its alternatives →
- 18

I do lots of data analyses in the command-line and I was missing a simple utility to plot the output of a command (without having to script it). I like very much the Matplotlib API but I found no CLI to pipe data into it. So, I wrote MatplotCLI, a simple CLI that reads data from the stdin and allows to easily create interactive plots from the command-line. Have a look at the README for examples and recipes. Let me know what you think, thanks! Some examples: $ plt "hist(x,30)" < sample.json $ cat sample.json | plt --no-show "hist(x,30); savefig('myimage.png')" $ plt --no-input " x =…
2022 · github.com · its alternatives →
- 19MM
2021 · everydayanchovies.github.io · its alternatives →
- 20
 ChartPixel▲80
Extract & visualize key insights from raw data in seconds!
2024 · chartpixel.com · its alternatives →
- 21

- 22
 RankReel▲96
Create animated ranking charts from your data instantly
2024 · rankreel.app · its alternatives →
- 23

Fast by default, flexible 2D plotting library. Contribute to wwwtyro/candygraph development by creating an account on GitHub.
2021 · github.com · its alternatives →
- 24

Make powerful, interactive machine learning visualizations
2020 · wandb.ai · its alternatives →
Also compare
Ranked by how close each launch is in meaning, then by votes. Prices were read from each product’s own site when checked and can change. Refine with your own description →