Life & fun · alternatives · 2026

24 alternatives to Sonification of Income Inequality on the NYC Subway
Sonification of Income Inequality on the NYC Subway
Sonification of Income Inequality on the NYC Subway is an audio project that transforms median household income data into music. Created by Brian Foo, it emulates a ride on the 2 Train through Brooklyn, Manhattan, and… Below are 24 products that do a similar job, ranked by how close each is in meaning and then by launch-day votes. Sonification of Income Inequality on the NYC Subway launched in 2015; newer entries below may have overtaken it.
- 1IN
Hey HN! I wanted to share something I built over the last few weeks: isometric.nyc is a massive isometric pixel art map of NYC, built with nano banana and coding agents. I didn't write a single line of code. Of course no-code doesn't mean no-engineering. This project took a lot more manual labor than I'd hoped! I wrote a deep dive on the workflow and some thoughts about the future of AI coding and creativity: http://cannoneyed.com/projects/isometric-nyc
Jan 2026 · cannoneyed.com · its alternatives →
- 2

San Francisco as one giant isometric pixel painting — the city
Aug 2026 · sf.isopolis.city · its alternatives →
- 3SA
Hey HN, My cofounder and I trained an AI music generation model and after a month of testing we're launching 1.0 today. Ours is interesting because it's a latent diffusion model instead of a language model, which makes it more controllable: https://sonauto.ai/ Others do music generation by training a Vector Quantized Variational Autoencoder like Descript Audio Codec (https://github.com/descriptinc/descript-audio-codec) to turn music into tokens, then training an LLM on those tokens. Instead, we ripped the tokenization part off and replaced it with a normal…
2024 · sonauto.ai · its alternatives →
- 4

- 5NS
Hello HN! As a long term NYC resident, I have read countless articles on ideas tweaking subway services, but always found them hard to follow without visual aid. So over the long weekend I decided to build one. It has all the basic features: trains would spawn at their origin, stop at stations, and slow down if it gets too close to another. You can also design custom routes by piecing tracks together. Have fun, and let me know what you think!
2025 · buildmytransit.nyc · its alternatives →
- 6

Animated live map of the Berlin city trains
2022 · xn--ubhnchen-1za.vercel.app · its alternatives →
- 7

- 8
- 9HW
Harmogram is an Audio Visual experiment made by Adrian le Bas and powered by the HTML5 Audio API
2012 · harmogram.com · its alternatives →
- 10
 Sonauto v2 Beta▲271
Generate full songs with a prompts, melody, or lyrics
2025 · treblo.com · its alternatives →
- 11

This was something I built while trying to look for housing in Toronto that was decently transit-accessible to my office while still cheap. The backend is written in Rust. It parses public GTFS data from transit agencies and performs a simple heuristics-based BFS on the bus lines to calculate how long to reach all points in a city. The frontend uses React and Mapbox GL to render each individual road segment based on how long it takes to reach. This project was a great excuse to learn Rust, deployments, and mapping. The source code is here if you are interested:…
2023 · map.henryn.xyz · its alternatives →
- 12

An interactive 3D visualization of the all the buildings in Manhattan.
2018 · tbaldw.in · its alternatives →
- 13

I previously made a web version of The Weekendest, but when I was laid off from my last job, I decided to take the free time I had to pick up Swift UI, and made a native iOS version of it. The main draw of the app is that the map is dynamically generated based on the current subway routing, so when you open the app on weekends or overnight, you'll see lines correspond to where the trains are actually running, which is a very unique NYC problem. Let me know what you think!
2024 · apps.apple.com · its alternatives →
- 14

- 15

ossia score, an interactive sequencer for the intermedia arts - ossia/score
2025 · github.com · its alternatives →
- 16

2019 · income-inequality.info · its alternatives →
- 17
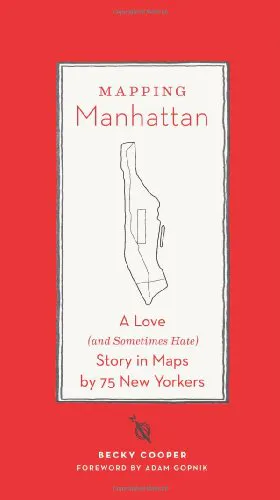
Gorgeous maps through the eyes of 75 New Yorkers
2015 · amazon.com · its alternatives →
- 1810
- 19

Each moving arrow represents one real bike ride out of 291 million, and if you've ever taken a Citi Bike before, you are included in this massive visualization! You can search for your ride using Cmd + K and your Citi Bike receipt, which should give you the time of your ride and start/end station. Everything is open source: https://github.com/freemanjiang/bikemap Some technical details: - No backend! Processed data is stored in parquet files on a Cloudflare CDN, and queried directly by DuckDB WASM - deck.gl w/ Mapbox for GPU-accelerated rendering of thousands of…
Jan 2026 · bikemap.nyc · its alternatives →
- 20
- 21

The soaring costs of water in NYC in low-income areas
2015 · soundcloud.com · its alternatives →
- 22

OP here. This is a geometric decoding of Chopin's Prelude No. 4. I built a 3D music midi visualizer ( https://github.com/jimishol/cholidean-harmony-structure ) and realized that standard music theory couldn't explain the shapes I was seeing. So, I developed the Umbilic-Surface Grammar to map the topology of the harmony. This document demonstrates that the prelude's tension isn't random, but a rigorous conflict between 'Gravity' (Station Shifts) and 'Will' (Pivots). I am looking for feedback on the logic—specifically from anyone with a background in topology or music…
Feb 2026 · github.com · its alternatives →
- 23

Explore the Berlin subway system using Memgraph Lab, mapping subway stops as nodes and connections as edges in a graph database.
2023 · memgraph.com · its alternatives →
- 24
Also compare
- isometric.nyc – giant isometric pixel art map of NYC alternatives
- Isopolis – Isometric pixel map of SF alternatives
- Sonauto – A more controllable AI music creator alternatives
- The Weekendest iOS App alternatives
- NYC Subway Simulator and Route Designer alternatives
- Ubähnchen – Animated subway map of Berlin alternatives
Ranked by how close each launch is in meaning, then by votes. Prices were read from each product’s own site when checked and can change. Refine with your own description →