Life & fun · December 16, 2023

Visualising Rising Temperatures for the Netherlands
Something I've been working on this weekend: visualising climate change in the Netherlands. https://koenvangilst.nl/blog/rising-temperatures I particularly liked the heatmap with monthly temperature data since the 1900s. It's a lot of scrolling, but you can clearly see that climate is accelerating since the '90s.
Visualising Rising Temperatures for the Netherlands launched on December 16, 2023 with 6 votes, #1,302 of 3,780 launches that month and more than 50% of that year's launches. The site was still online in September 2026, 2 years on.
What it does
Visualizing the weather anomalies in rainfall, sunshine and temperature in the Netherlands using data from the Dutch Meteorological Institute (KNMI).
without some news of our changing climate. Here in the Netherlands, we're also experiencing this firsthand – our summers are hotter and our winters milder. In this blog post, I've tried to visually capture these changes. By using weather data from the Dutch Meteorological Institute (KNMI), I've created a series of visualizations that show how the average temperature, rainfall and sunshine in the Netherlands has changed since the 1900s. The three visualizations present the yearly anomalies in the Netherlands starting from 1906. The data, sourced from a weather station in De Bilt , is based on the average of each year, compared to the average during the period 1906-2000. This visualization is…from koenvangilst.nl
Does a similar job
all alternatives →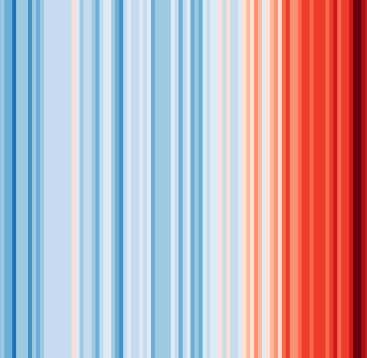 #ShowYourStripes2019 · showyourstripes.info · ▲140
Visualize 100+ years of climate change where you live ❄️🌎🔥
 I created this land use visualisation for the Netherlands2024 · koenvangilst.nl · ▲78
Last weekend, I tried creating an original visualization of something on many minds in my home country the Netherlands: land use. Much of our discussion revolves around land use—housing crisis, sustainable farming, solar energy—it's all about the land. To illustrate this, I created a map where each hexagon represents 0.06% (26,647 hectares) of land in the Netherlands. The color indicates the type of land use.
 An interactive map showing live wind farm generation in Great Britain2023 · renewables-map.robinhawkes.com · ▲245
GB Renewables Map an energy experiment created entirely in my free time (day job is visualisation at Octopus Energy). It's an interactive map showing live generation for major wind farms in Great Britain, showing what each wind farm is generating both now and in the past, and where that generation is physically located. Animated weather data is from WeatherLayers and shows current and historic wind conditions on the map, providing context to wind generation around the country. History mode allows you to go back in time and see wind generation and weather conditions for a particular date and…
- AWA WebGL visualization to show how global temperature changed since 18502016 · callumprentice.github.io · ▲69
Global Temperature Change WebGL</i> is an experiment that tries to illustrate how global temperatures on earth have changed between 1850 and 2016.


More life & fun this month
the category →
A free city-building game in your browser. You are the mayor. You know what the city needs. Now get it past the zoning board, the neighbors, the appeals court and the next election.
Life & fun · 2d ago · permit.petercai.com
- IV
Life & fun · 14d ago · tanzaniaeducationproject.org

Turn a phone, tablet or TV into a sign. Type a message and it fills the screen: welcome signs, timers, Wi-Fi passwords and more. No app, no account, free.
Life & fun · 15d ago · bigwords.page

Play a free virtual guitar online with your keyboard or by touch. Slow songs down and see every chord, string and strum. Acoustic, classic, electric and bass.
Life & fun · 9d ago · guitoro.com

Carrier settings from iPhone, Pixel and Galaxy firmware, decoded and compared: APNs, VoLTE, 5G and Wi-Fi Calling per carrier, and what each build changed.
Life & fun · 13d ago · carrierexplode.com

Life & fun · 23d ago · space.bl2.net
Source: Show HN post ↗
Launched alongside, December 2023
the whole month →
Hi HN! I’m proud to share that we have built a real 3rd party iMessage client for Android. We did it by reverse engineering the iMessage protocol and encryption system. It's available to download today (no waitlist): https://play.google.com/store/apps/details?id=com.beeper.ima and there's a technical writeup here: https://blog.beeper.com/p/how-beeper-mini-works. Unlike every other attempt to build an iMessage app for Android (including our first gen app), Beeper Mini does not use a Mac server relay in the cloud. The app connects directly to Apple…
Work · 2023 · beeper.com

Hey! I made Heynote entirely for my own use case. For many years, I always had an Emacs instance running with the scratch buffer open, even long after I had abandoned Emacs as my programming editor in favor of more recent IDE:s. The simplicity of having just one big scratch buffer appeals to me, but I still want to separate the different things I jot down somehow (without using tabs or similar). Previously, my solution was to insert a bunch of blank lines between the notes, but hitting C-A would still select the entire buffer. That's why I came up with the concept of "blocks", which turned…
Work · 2023 · heynote.com

 FuseBase▲939
Client collaboration platform for professional services
Dev tools · 2023 · thefusebase.com
 Beep! 2.0▲871
Fastest tool to assign and share visual tasks with your team
Work · 2023 · justbeepit.com
 Inbox Zero▲821
Clean Up Your Inbox In Minutes Newsletter management, AI automation, and email analytics. Inbox Zero is the open-source email app that puts you back in control of your inbox.
AI · 2023 · getinboxzero.com