AI · alternatives · 2026

24 alternatives to ShowMeOnMap
Ask a question, get a map from live data
Below are 24 products that do a similar job, ranked by how close each is in meaning and then by launch-day votes.
- 1

View an interactive crime map and stats for San Francisco with Safemap, a completely free tool. Put your safety in your own hands.
2024 · safemap.io · its alternatives →
- 2
- 3IM
Updated: Annadel/Kenwood to Napa 10/18, SR 10/12. Satellite fire map w/address search & compare mode. By Overview News © Digital Globe. Hosting by Mapbox
2017 · robinkraft.github.io · its alternatives →
- 4

Analysing satellite imagery of the Jan 2025 Southern California wildfires - xingyzt/fire
2025 · github.com · its alternatives →
- 5SN
After reading "During Helene, I Just Wanted a Plain Text Website" on Sparkbox (https://news.ycombinator.com/item?id=46494734) , I built safe-now.live – a text-first emergency info site for USA and Canada. No JavaScript, no images, under 10KB. Pulls live FEMA disasters, NWS alerts, weather, and local resources. This is my first live website ever so looking for critical feedback on the website. Please feel free to look around. https://safe-now.live
Feb 2026 · safe-now.live · its alternatives →
- 6
 Chestnut▲75
Get your free wildfire risk analysis in under a minute
2019 · getchestnut.com · its alternatives →
- 7TT
Simulate anything on a map from a text prompt -- and conduct risk analysis against LiveUA map's global realtime data points from social media and news sources. I trained a GPT-2-size model on historical incident data used to predict things that will go wrong. As historian Benjamin Breen mentions, the leading language models are good historians, so the application will simulate historical events pretty well also. I include a Multi-Agent RL Urban Mobility model in progress displayed on the map as small white cubes representing traffic and pedestrians. Around SF, it uses real census data and…
2025 · mused.com · its alternatives →
- 8

Hey HN! I love finding new books to read on here. I wanted to gather the most mentioned books and recreate the serendipity of physical browsing. I scraped 20k comments from HN threads related to reading, extracted the references and opinions using GPT-4o mini, and visualised their embeddings as a map. - OpenAI's embeddings were processed using UMAP and HDBSCAN. A direct 2D projection from the text embeddings didn't yield visually interesting results. Instead, HDBSCAN is first applied on a high-dimensional projection. Those clusters tend to correspond to different genres. The genre…
2024 · hnbooks.pieterma.es · its alternatives →
- 9
 TimeMap▲325
Interactive Map of History: millions of people, events, maps
2024 · oldmapsonline.org · its alternatives →
- 10

GB Renewables Map an energy experiment created entirely in my free time (day job is visualisation at Octopus Energy). It's an interactive map showing live generation for major wind farms in Great Britain, showing what each wind farm is generating both now and in the past, and where that generation is physically located. Animated weather data is from WeatherLayers and shows current and historic wind conditions on the map, providing context to wind generation around the country. History mode allows you to go back in time and see wind generation and weather conditions for a particular date and…
2023 · renewables-map.robinhawkes.com · its alternatives →
- 11

See where people click so you can improve your page
2014 · bdow.com · its alternatives →
- 12

- 13

- 14

Visualize the damage done by wild fires in California
2017 · robinkraft.github.io · its alternatives →
- 15
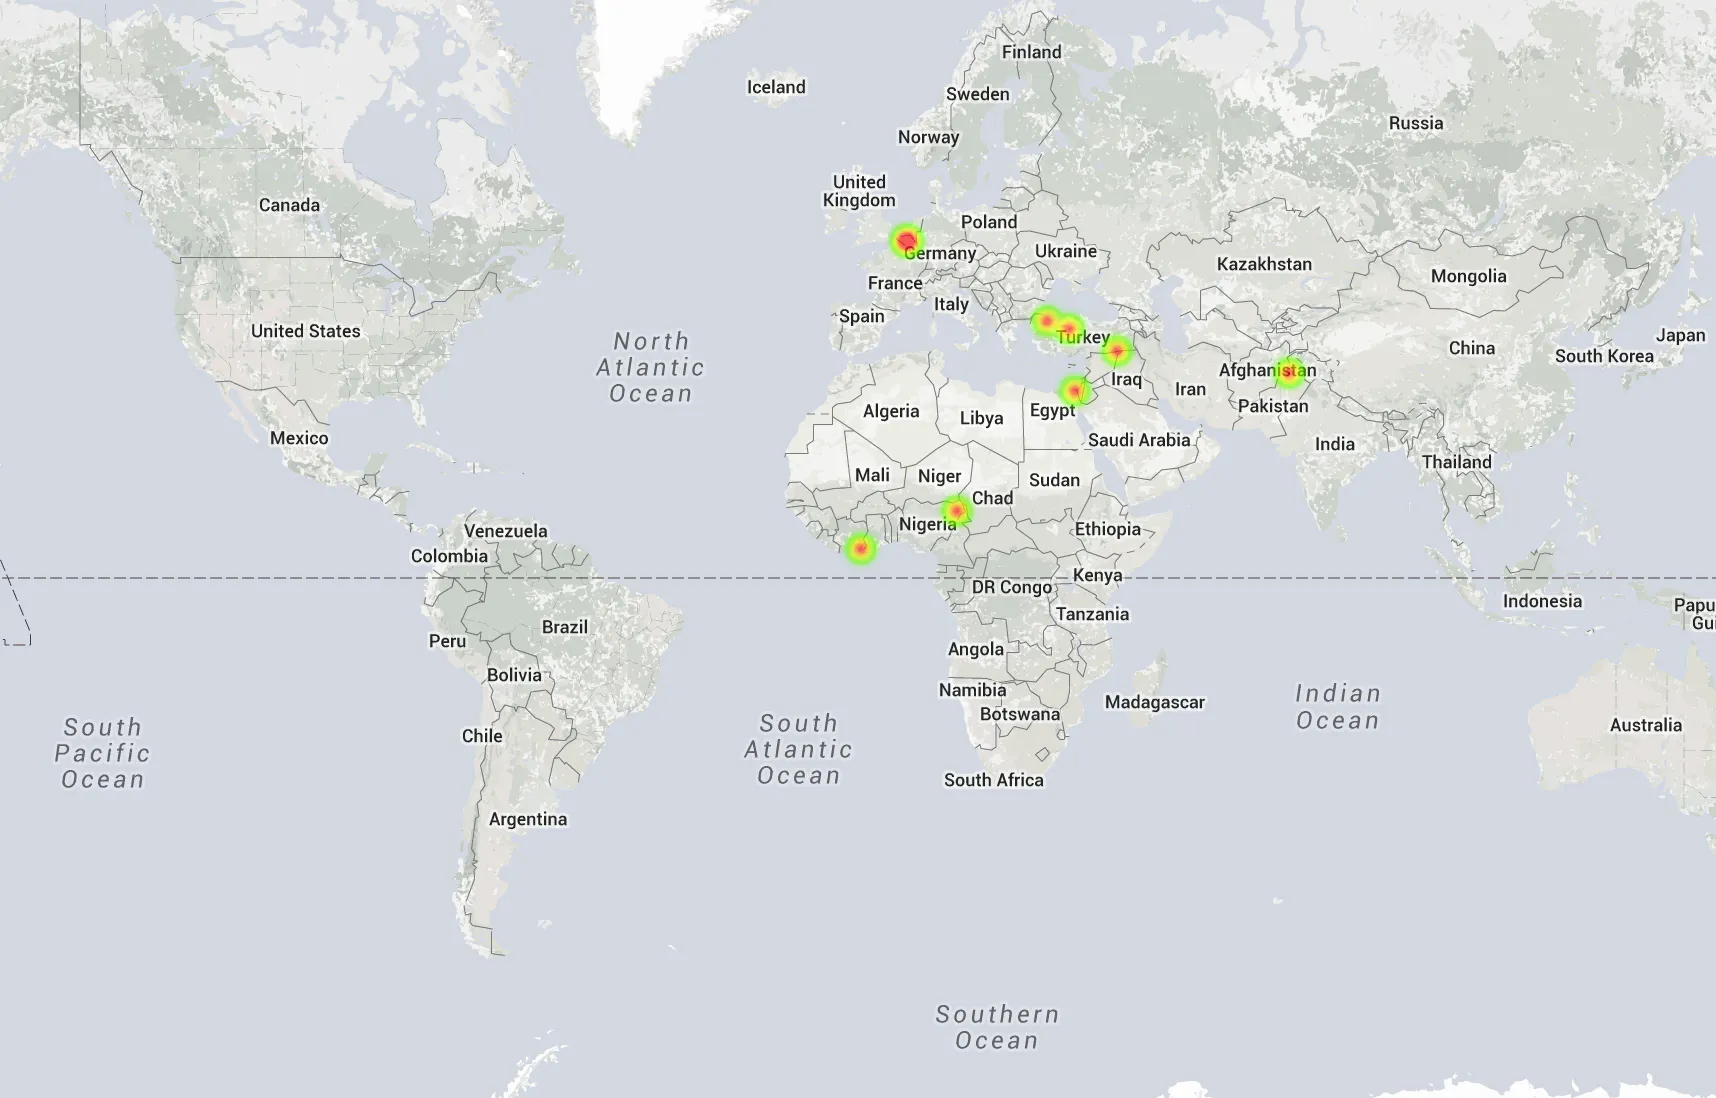 AttackMap▲94
A crowdsourced map of attacks happening now around the world
2016 · attackmap.info · its alternatives →
- 16AI
This is an interactive map of US navigational aids and lighthouses, which indicates their location, color, characteristic and any remarks the Coast Guard has attached. I was sick at home with the flu this weekend, and went on a bit of a Wikipedia deep dive about active American lighthouses. Searching around a bit, it was very hard to find a single source or interactive map of active beacons, and a description of what the "characteristic" meant. The Coast Guard maintains a list of active lights though, that they publish annually…
Jan 2026 · lighthouses.app · its alternatives →
- 17
 FATMAP▲88
Global 3D map and adventure guidebook for the outdoors!
2018 · strava.com · its alternatives →
- 18

Track wildfires across the nation
2022 · wildfires.areahub.com · its alternatives →
- 19
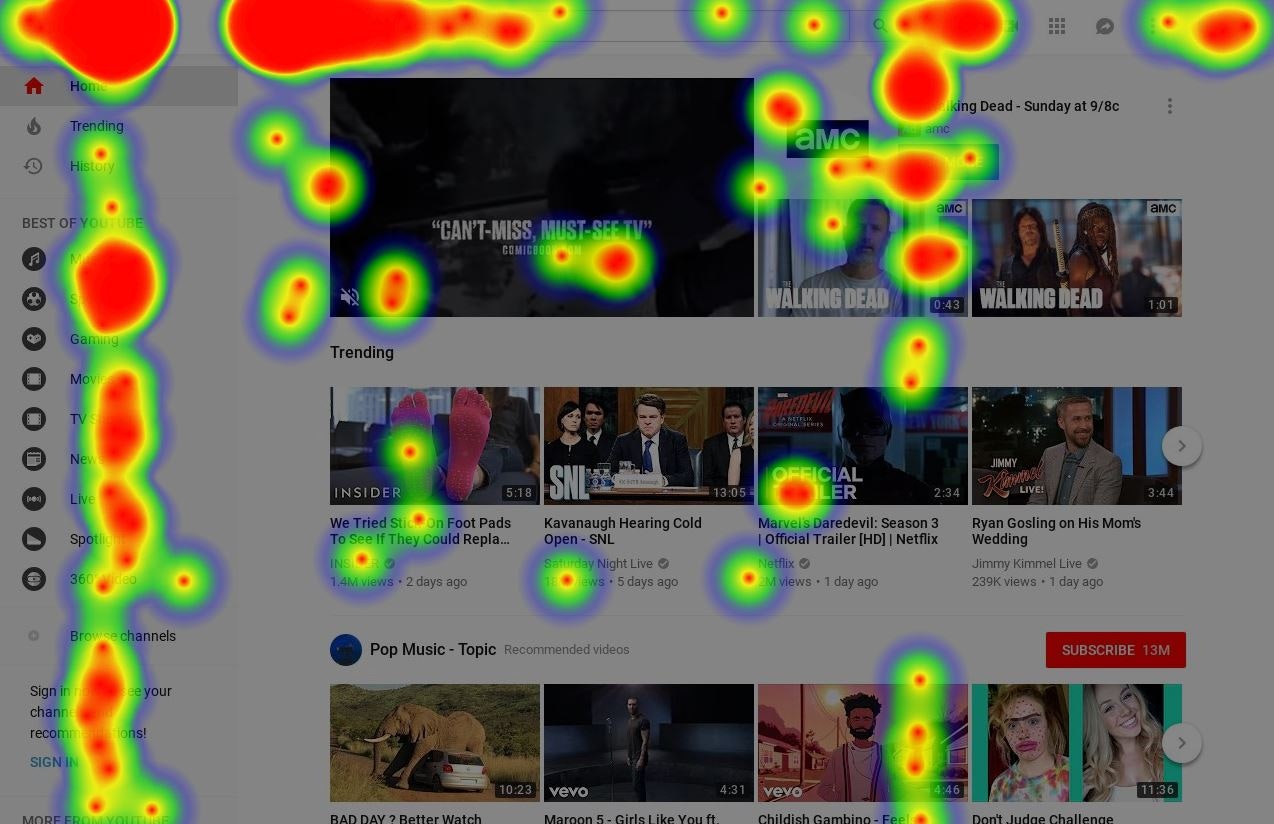
Any website's heatmap data is at your fingertips
2018 · its alternatives →
- 20

Incendios en España y Portugal hoy en tiempo casi real: focos por satélite NASA, área quemada de Copernicus, viento con la dirección del humo y municipios afectados.
Jul 2026 · firemapsspain.online · its alternatives →
- 21

The simple and open source user story mapping tool. - amborle/featmap
2019 · github.com · its alternatives →
- 22
- 23MMapipedia▲61
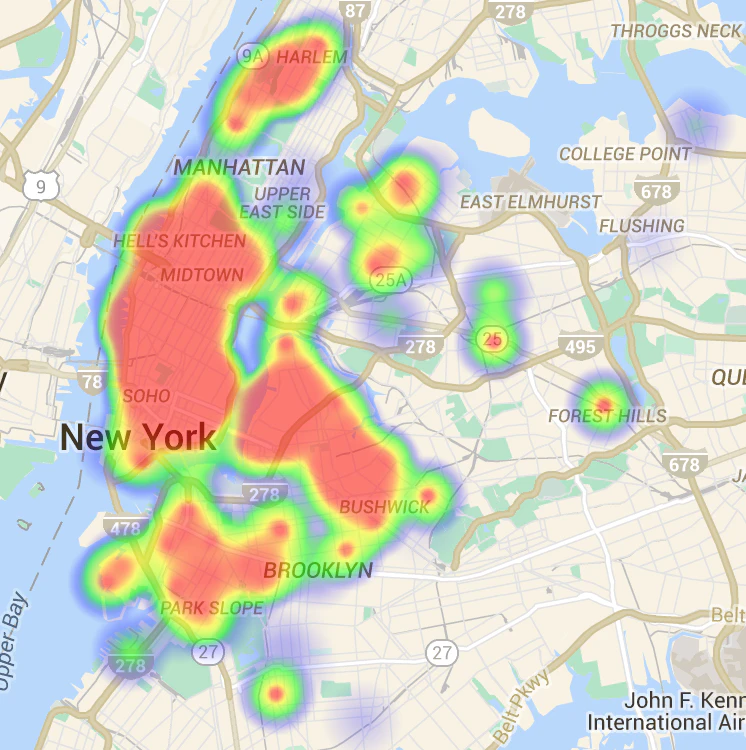
A web platform I've written to make it easy for people to share goespatial time series data and display it on animated heatmaps. There's also a social media component that allows you to write comments, follow, share and like data sets that you want to engage with. You can also download the CSV data and embed animations into your own websites. People uploading datasets can also choose to make money by accepting donations. Please check out the home page for more details: https://mapipedia.com Here are some samples of things created with the platform (press the play button to start…
2019 · its alternatives →
- 24

A data aware UI components library for building realtime maps - reactivemaps/README.md at master · appbaseio/reactivemaps
2017 · github.com · its alternatives →
Also compare
- Play with an interactive heatmap of SF crime (and other cities) alternatives
- FEMA Data Vizualization alternatives
- I made this satellite map of NorCal wildfires. Search for your address alternatives
- LA Wildfire Satellite Analysis alternatives
- Safe-now.live – Ultra-light emergency info site (<10KB) alternatives
- Chestnut alternatives
Ranked by how close each launch is in meaning, then by votes. Prices were read from each product’s own site when checked and can change. Refine with your own description →