Life & fun · alternatives · 2026

24 alternatives to Visualisation of temperatures of 321 cities of the world 1995 to 2020
Below are 24 products that do a similar job, ranked by how close each is in meaning and then by launch-day votes. Visualisation of temperatures of 321 cities of the world 1995 to 2020 launched in 2020; newer entries below may have overtaken it.
- 1

2021 · weatherspark.com · its alternatives →
- 2
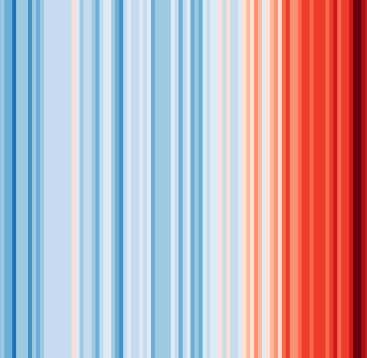 #ShowYourStripes▲140
Visualize 100+ years of climate change where you live ❄️🌎🔥
2019 · showyourstripes.info · its alternatives →
- 34Y
Apr 2026 · ssta.willhelps.org · its alternatives →
- 4AW
Global Temperature Change WebGL</i> is an experiment that tries to illustrate how global temperatures on earth have changed between 1850 and 2016.
2016 · callumprentice.github.io · its alternatives →
- 5
 WeatherNext 3▲129
Our most advanced and accurate global weather AI model
Sep 2026 · blog.google · its alternatives →
- 6

An interactive 3D visualization of the all the buildings in Manhattan.
2018 · tbaldw.in · its alternatives →
- 7
 Karl Weather▲82
A beautiful SF microclimate weather app for iOS
2017 · apps.apple.com · its alternatives →
- 8

- 9

Mapping the future of human civilisations from Asia to US
2016 · blcw.me · its alternatives →
- 10
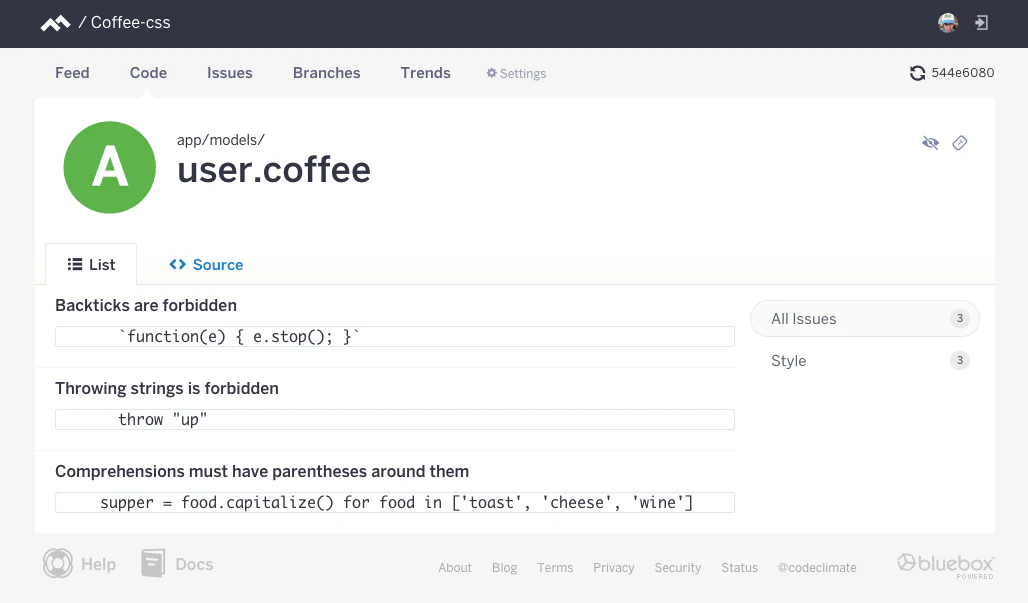
The first open and extensible platform for static analysis
2015 · codeclimate.com · its alternatives →
- 11

Explore global weather forecasts on interactive maps with temperature, wind, and precipitation overlays. 16-day outlooks for cities worldwide, powered by NOAA GFS.
2014 · weather-explorer.com · its alternatives →
- 12
 Globestudio▲84
Open-source dotted maps and 3D globes for designers
25d ago · globestudio.app · its alternatives →
- 13FW
Jul 2026 · wfy24.com · its alternatives →
- 14UW
2013 · uk.temperature.at · its alternatives →
- 15

Something I've been working on this weekend: visualising climate change in the Netherlands. https://koenvangilst.nl/blog/rising-temperatures I particularly liked the heatmap with monthly temperature data since the 1900s. It's a lot of scrolling, but you can clearly see that climate is accelerating since the '90s.
2023 · koenvangilst.nl · its alternatives →
- 16
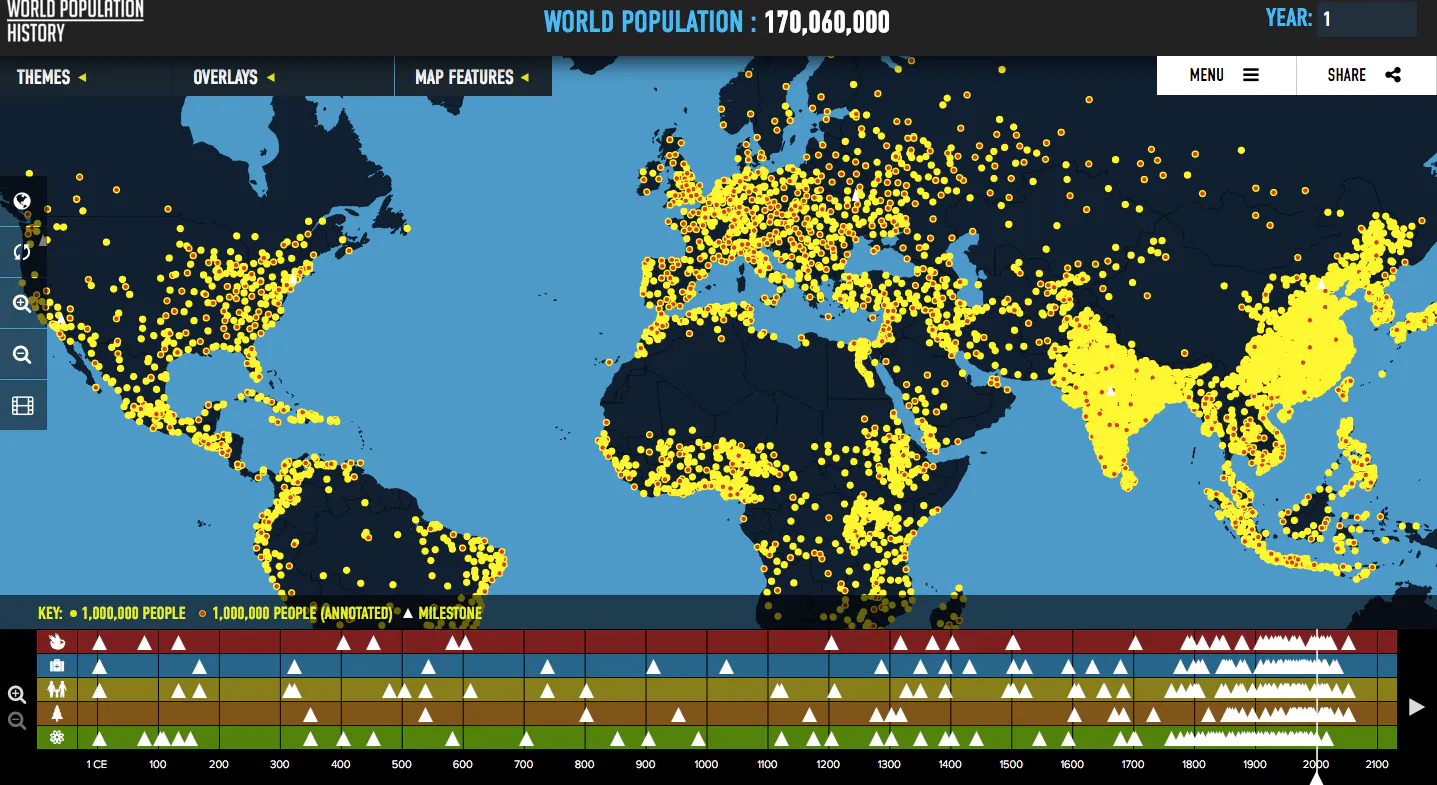
Visualizes global population trends over the last two thousa
2016 · worldpopulationhistory.org · its alternatives →
- 17IT
2014 · maptimed.com · its alternatives →
- 18

I built an interactive 3D globe to visualize climate change. Drag a temperature slider from -40°C to +40°C, set a timeframe (10 to 10,000 years), and watch sea levels rise, ice sheets melt, vegetation shift, and coastlines flood... per-pixel from real elevation and satellite data. Click anywhere on the globe to see projected snowfall changes for that location. --- I'm an amateur weather nerd who spends a lot of time on caltopo.com and windy.com tracking snow/ice conditions. I wanted to build something fun to imagine where I could go ski during an ice age. I used Google Deep Research…
Mar 2026 · terrashift.io · its alternatives →
- 19DD
2022 · wxrecords.com · its alternatives →
- 20GO
2013 · pndv.cumulonimbus.ca · its alternatives →
- 21BC
2019 · berlin-weather.herokuapp.com · its alternatives →
- 22WA
2015 · callumprentice.github.io · its alternatives →
- 23GS
2014 · gridvisual.com · its alternatives →
- 24
 Earth▲4
An intetractive map of global weather conditions
2015 · earth.nullschool.net · its alternatives →
Also compare
- A world map of 24x365 average temperature “fingerprints” alternatives
- #ShowYourStripes alternatives
- 41 years sea surface temperature anomalies alternatives
- A WebGL visualization to show how global temperature changed since 1850 alternatives
- WeatherNext 3 alternatives
- Interactive WebGL visualization of all 47K buildings in Manhattan alternatives
Ranked by how close each launch is in meaning, then by votes. Prices were read from each product’s own site when checked and can change. Refine with your own description →