Life & fun · alternatives · 2026
24 alternatives to 41 years sea surface temperature anomalies
This dataset visualizes sea surface temperature anomalies over 41 years, showing how ocean temperatures have deviated from historical averages. It is designed for climate researchers, oceanographers, and environmental… Below are 24 products that do a similar job, ranked by how close each is in meaning and then by launch-day votes.
- 1P3
2020 · leeoniya.github.io · its alternatives →
- 2AW
Global Temperature Change WebGL</i> is an experiment that tries to illustrate how global temperatures on earth have changed between 1850 and 2016.
2016 · callumprentice.github.io · its alternatives →
- 3
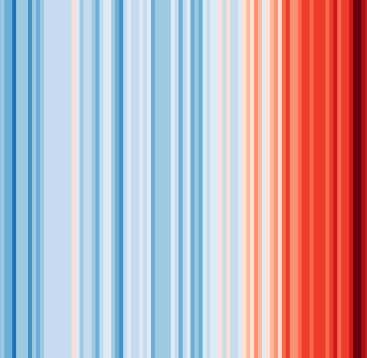 #ShowYourStripes▲140
Visualize 100+ years of climate change where you live ❄️🌎🔥
2019 · showyourstripes.info · its alternatives →
- 4

2021 · weatherspark.com · its alternatives →
- 5

Earth looked very different long ago. Search for addresses across 750 million years of Earth
2018 · dinosaurpictures.org · its alternatives →
- 6

Analysis-ready weather and climate data at your fingertip with Oikolab API.
2021 · oikolab.com · its alternatives →
- 7
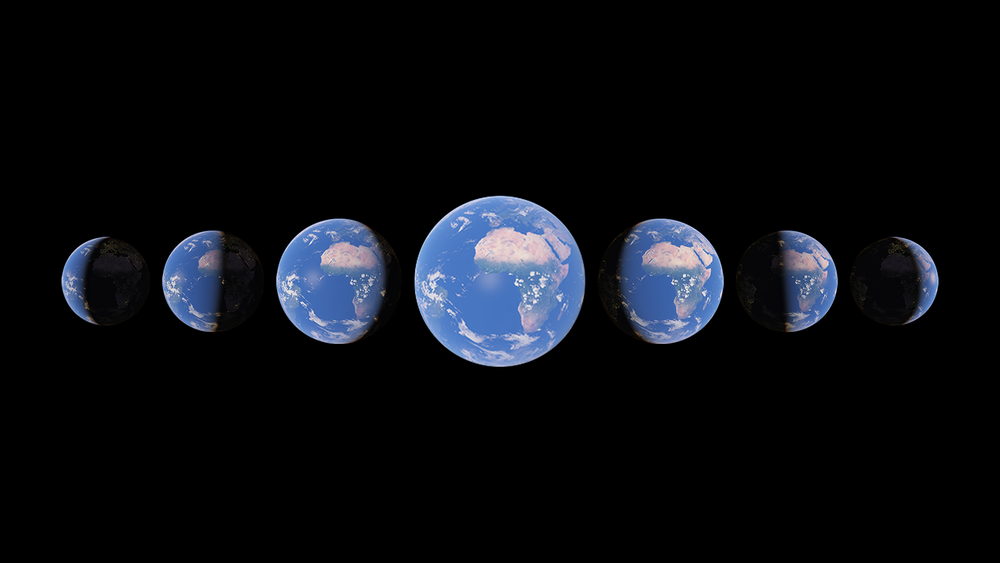
Watch time unfold and witness 40 years of planetary change
2021 · earth.google.com · its alternatives →
- 8PT
This was posted before but I'm quite pleased to share a major update for https://oikolab.com. We now have available seven decades of hourly weather data starting from 1950 for any location in the world, thanks to the recent publication of ERA5 reanalysis data from European Centre for Medium-Range Weather Forecasts (ECMWF). ERA5 is gap-free, gridded dataset generated using data assimilation method (https://en.wikipedia.org/wiki/Data_assimilation), similar to NWP models but with the benefit of hindsight. As far as we're aware of, we're the first weather data…
2020 · its alternatives →
- 9

I built an interactive 3D globe to visualize climate change. Drag a temperature slider from -40°C to +40°C, set a timeframe (10 to 10,000 years), and watch sea levels rise, ice sheets melt, vegetation shift, and coastlines flood... per-pixel from real elevation and satellite data. Click anywhere on the globe to see projected snowfall changes for that location. --- I'm an amateur weather nerd who spends a lot of time on caltopo.com and windy.com tracking snow/ice conditions. I wanted to build something fun to imagine where I could go ski during an ice age. I used Google Deep Research…
Mar 2026 · terrashift.io · its alternatives →
- 10CW
A structured archive of CIA World Factbook data spanning 1990–2025. It currently includes: 36 editions 281 entities ~1.06M parsed fields full-text + boolean search country/year comparisons map/trend/ranking analysis views CSV/XLSX/PDF export The goal is to preserve long-horizon public-domain government data and make cross-year analysis practical. Live: https://cia-factbook-archive.fly.dev About/method details: https://cia-factbook-archive.fly.dev/about Data source is the CIA World Factbook (public domain). Not affiliated with the CIA or…
Feb 2026 · cia-factbook-archive.fly.dev · its alternatives →
- 11

QuestDB live demo. Query three large datasets and more than 2 billion rows in milliseconds with SQL
2020 · try.questdb.io · its alternatives →
- 12

A Python toolkit for rule-based/unsupervised anomaly detection in time series - arundo/adtk
2019 · github.com · its alternatives →
- 13
 Globe of History▲189
I built Globe of History — an interactive 3D visualization of 6,000 years of human events, mapped onto the Earth’s surface. It includes 5,000+ data points covering wars, inventions, assassinations, natural disasters, and philosophers — spanning 4000 BCE → 2025 CE. The main goal was to build a visual entry point into history — not a database, but a way to instantly sense density and continuity over time. Stack / Process Python for scraping structured event data from Wikipedia/Wikidata Gemini 2.0 Flash for AI-based enrichment and multi-stage verification Mapbox GL JS + React (Vite)…
Nov 2025 · globeofhistory.com · its alternatives →
- 14

- 15

OP here: I created this visualization tool as the byproduct of a supply chain class I taught at Columbia. The pedagogical exercise grew into a full blown visualization and paper about global oil trade. The model: The mechanics are the same as the financial network Eisenberg-Noe: Instead of banks, every country consumes oil interconnected via bilateral trading. Shocks propagate throughout the network, depleting oil reserves when bottleneck nodes (such as the Strait of Hormuz) are blocked. Insights: The interesting part is the mechanics of how the crisis unfolds: for example, France receives 0…
Jul 2026 · globaloilnetwork.staffinganalytics.io · its alternatives →
- 16
 Weather Lab▲177
Predicting cyclone paths & intensity 15 days ahead
2025 · accounts.google.com · its alternatives →
- 17

A rotatable Earth that drags today's countries and major cities through the Merdith 2021 plate reconstruction model, plus a simple future extrapolation. Continents keep their color families while the land follows plate motion from 1000 million years ago to 250 million years ahead.
Aug 2026 · douwe.com · its alternatives →
- 18DWDegrees What?▲171
One of my pet peeves is when people specify a temperature in "degrees" when it’s not clear from the context which scale is being used. I always want to ask “degrees what?” So I made this little conversion tool that uses degrees angle to convert between degrees Fahrenheit and degrees Celsius. Tip: you can add a number in a query to link directly to a temperature. e.g. https://degreeswhat.com/?100
2023 · degreeswhat.com · its alternatives →
- 19

- 20

Interactive UK house price heatmap with 30 years of data. Search any postcode to explore average prices, trends and transaction volumes from 1995 to 2026.
Jan 2026 · housepricedashboard.co.uk · its alternatives →
- 21

A Python library for detecting patterns and anomalies in massive datasets using the Matrix Profile - target/matrixprofile-ts
2019 · github.com · its alternatives →
- 22

2020 · todaystrends.app · its alternatives →
- 23FW
2012 · callum.com · its alternatives →
- 24

This little project came about because I kept running into the same problem: cleanly differentiating sensor data before doing analysis. There are a ton of ways to solve this problem, I've always personally been a fan of using kalman filters for the job as its easy to get the double whammy of resampling/upsampling to a fixed consistent rate and also smoothing/outlier rejection. I wrote a little numpy only bayesian filtering/smoothing library recently (https://github.com/hugohadfield/bayesfilter/) so this felt like a fun and very useful first thing to…
2024 · github.com · its alternatives →
Also compare
- Plotting 3 years of hourly data in 150ms alternatives
- A WebGL visualization to show how global temperature changed since 1850 alternatives
- #ShowYourStripes alternatives
- A world map of 24x365 average temperature “fingerprints” alternatives
- Plot modern addresses on Earth 240M years ago alternatives
- Get 70 Years of Historical Weather Data via API alternatives
Ranked by how close each launch is in meaning, then by votes. Prices were read from each product’s own site when checked and can change. Refine with your own description →